Kaplan-Meier Plotter: https://kmplot.com/analysis/
What is the KM plotter?
The Kaplan Meier plotter is capable to assess the correlation between the expression of 30k genes (mRNA, miRNA, protein) and survival in 25k+ samples from 21 tumor types including breast, ovarian, lung, & gastric cancer. Sources for the databases include GEO, EGA, and TCGA. Primary purpose of the tool is a meta-analysis based discovery and validation of survival biomarkers.
Click and link gene expression to meta-analysis based discovery and validation of su rvival biomarkers!
ROC Plotter – Online ROC analysis: http://www.rocplot.com/
What is the ROC Plotter? 
The ROC plotter is capable to link gene expression and response to therapy using transcriptome-level data of 3,104 breast cancer patients and 2,369 ovarian cancer patients.
Click and link gene expression to therapy efficacy using Roc Plot cancer analysis!
Scientometrics of Hungarian researchers: https://scientometrics.org/
Why was scientometrics.org established?
muTarget-connect mutation status to gene expression changes in solid tumours: https://www.mutarget.com/
What is the muTarget?
muTarget is a cancer biomarker / target discovery tool with two major functions
1) With a „genotype” run one can identify gene(s) showing altered expression in samples harbouring a mutated input gene. This option is useful in case one searches new drug targets in a cohort of patients with a given mutation.
2) With a „target” run one can identify mutations resulting in expression change in the input gene. This option is useful in case one has a drug target gene, and patient cohorts with enriched expression is the question.
Click to perform cancer analysis!
TNMplot: differential gene expression analysis in Tumor, Normal and Metastatic tissues: https://tnmplot.com/

What is the TNMplot?
TNMplot.com: A Web Tool for the Comparison of Gene Expression in Normal, Tumor and Metastatic Tissues. TNMplot is a registration-free online analysis portal which enables the mining of RNA-seq and gene chip data for any gene to assess expression differences in normal, malignant and metastatic samples.
Click to differential gene expression analysis in Tumor, Normal and Metastatic tissues!
Recurrence Online-Transcriptome Based Breast Cancer Diagnostics: genearray.recurrenceonline.com
What is Recurrence Online?
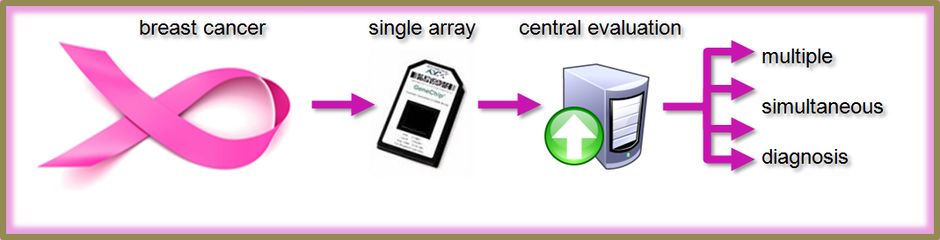
Recurrence Online is capable to predict response to hormonal treatment [ER status], response to targeted therapy [HER2 status] and survival [recurrence score] for breast cancer patients using gene expression data obtained by Affymetrix microarrays. Quality control algorithms are implemented to exclude biases related to sample processing, hybridization and scanning.
Multiple Testing Correction: https://multipletesting.com/

What is Multipletesting?
A tool for life science researchers for multiple hypothesis testing correction.
COVIDOUTCOME – Estimating COVID Severity Based on Mutations in the SARS-CoV-2 Genome: https://covidoutcome.com/