Peripheral Blood Mononuclear Cell (PBMC) Isolation and Freezing Protocol
The cellular composition of the blood sample (white blood cells [WBC], red blood cells [RBC], platelets [PLT], lymphocytes [LY], and neutrophil granulocytes [NEU]) is determined using a hematology analyzer (Sysmex). The sample is then diluted threefold with PBS (Gibco) containing 2 mM EDTA (Invitrogen).
White blood cells are separated from granulocytes and red blood cells by Ficoll density gradient centrifugation. The diluted sample (30–35 ml) is carefully layered onto 15 ml Ficoll solution (GE Healthcare, Merck Life Science) and centrifuged for 30 minutes at 400 g with the brake off. The thin PBMC layer formed above the Ficoll interface is gently collected with a pipette into a sterile tube, washed with PBS–EDTA buffer, and centrifuged again for 10 minutes at 300 g.
The pellets are resuspended in 20 ml PBS–EDTA buffer. The total volume is measured, and 1 ml of the sample is set aside for cell counting using the Sysmex analyzer and for FACS analysis. A second cell count is then performed. The remaining cell suspension is adjusted with PBS–EDTA to allow convenient dilution for freezing. The suspension is centrifuged again for 10 minutes at 300 g, the supernatant is removed, and the pellet is gently resuspended. An appropriate volume of freezing medium (50% fetal bovine serum [FBS, PAN Biotech], 40% RPMI basal medium [Gibco], 10% DMSO [Miltenyi]) is added to the cells.
The cell suspension is aliquoted into 1 ml cryovials and frozen at −80 °C for a maximum of 2 days, then transferred to liquid nitrogen for long-term storage.
Previously collected samples are characterized by flow cytometry after staining with surface markers CD3, CD4, CD8, CD20, CD14, and CD56.
Lymphocyte Population Identification by Flow Cytometry (FACS)
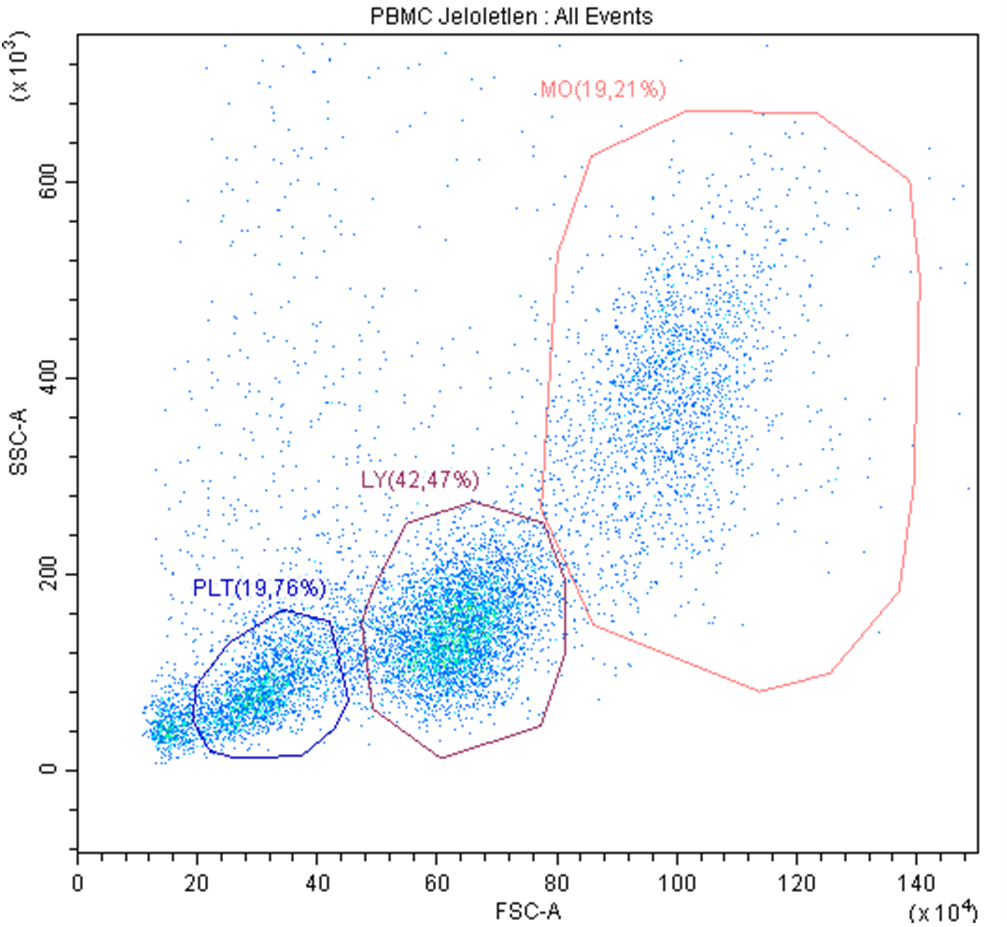
Analysis of Dot Plot Data
Within the PBMC sample, individual cell populations were distinguished based on cell size (FSC) and granularity (SSC) using flow cytometry. Three distinct cell populations were clearly separated:
-
PLT denotes platelets (thrombocytes), which are the smallest in size and lack a nucleus, resulting in the lowest granularity.
-
MO denotes monocytes, which are the largest cells and contain a nucleus.
-
LY denotes lymphocytes, the population of primary interest in this study. Lymphocytes have an average diameter of 6–7 µm and are of intermediate size compared to the other cell types.
CFSE Staining Protocol
Theoretical Background of CFSE Staining
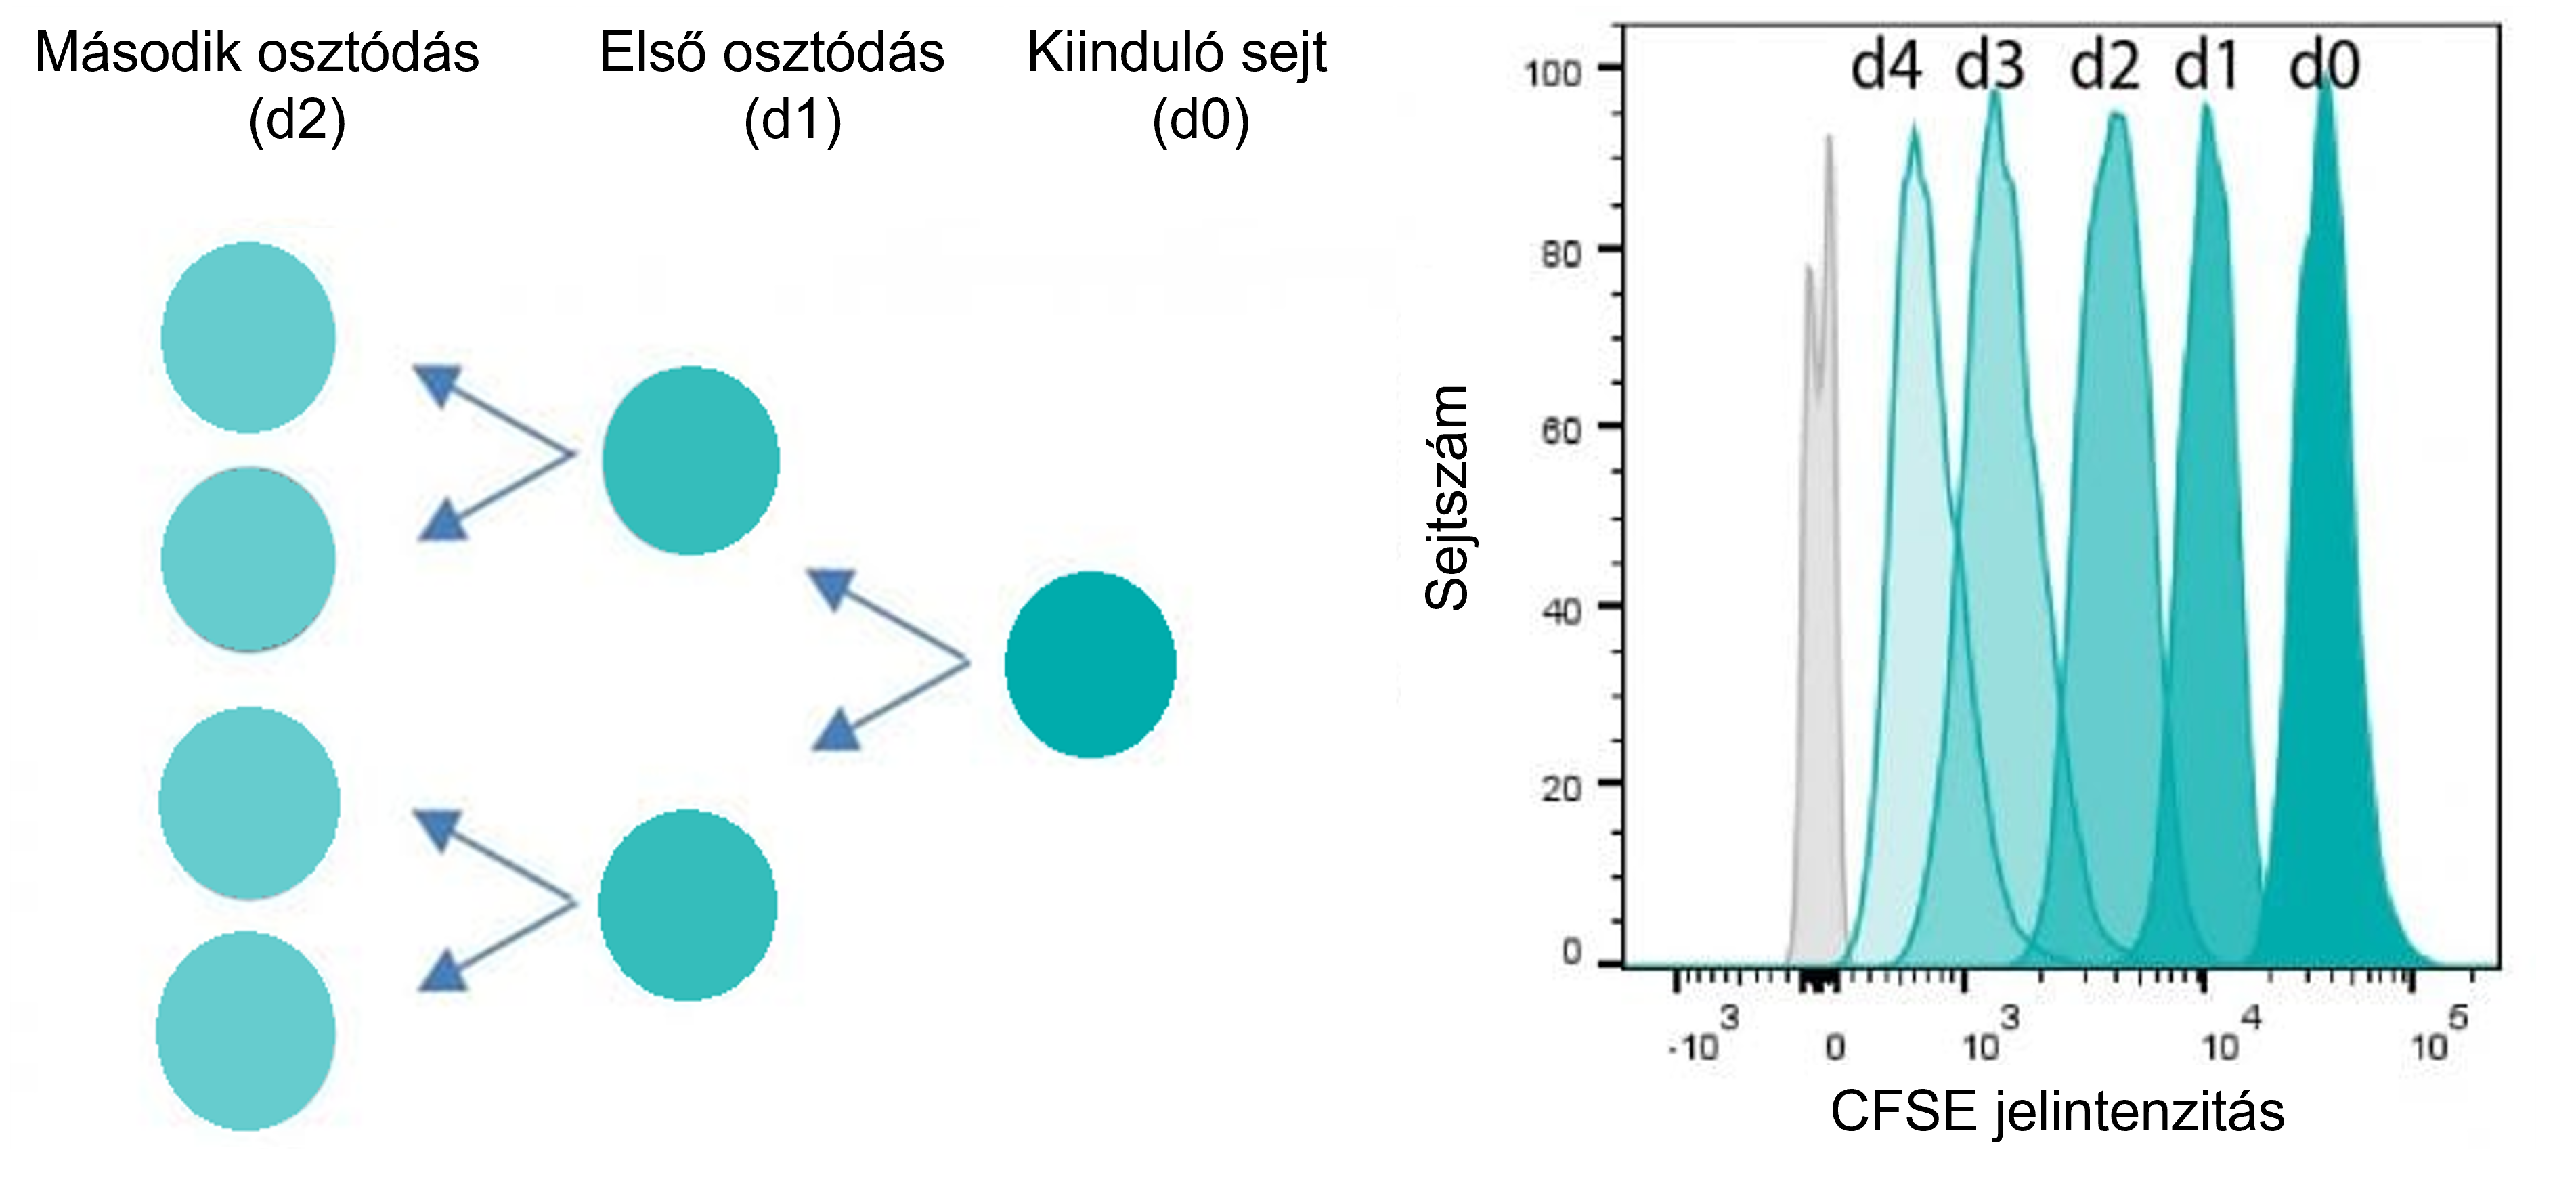
CFSE (Invitrogen), short for carboxyfluorescein diacetate succinimidyl ester, is a cell-permeable fluorescent dye. It readily diffuses through the cell membrane into the cytoplasm, where intracellular esterases cleave off the acetate groups. The resulting fluorescent molecule can no longer cross the membrane and becomes trapped inside the cytoplasm, providing stable cell labeling.
During cell division, the CFSE-containing cytoplasm is evenly distributed between daughter cells, leading to a halving of fluorescence intensity with each division cycle. By detecting the proportion of cells in which CFSE fluorescence intensity has decreased compared to the initial value, the percentage (or number) of proliferating cells can be determined.
CFSE Staining Protocol
Previously frozen PBMCs were used for the staining procedure. After thawing, cells were resuspended in 4 ml HBSS. Following homogenization, a sample was taken, and the cell suspension was centrifuged for 5 minutes at 350 g in a pre-cooled centrifuge (6 °C). Cell counts were determined from the collected sample using a Sysmex hematology analyzer. After centrifugation, the supernatant was discarded, the pellet was gently resuspended, and the cells were adjusted with PBS to a final concentration of 1 × 10⁷ cells/ml.
The homogenized cell suspension was transferred to an empty tube for labeling. Cells were stained with CFSE at a final concentration of 1 µM. The samples were incubated in the dark for 20 minutes at room temperature, allowing the dye to diffuse across the cell membrane and enter the cytoplasm. Meanwhile, unstained control samples were measured by flow cytometry.
After incubation, 4 ml of complete RPMI medium (RPMI supplemented with 10% FBS [PAN Biotech], 1% Penicillin-Streptomycin [Merck Life Science], and 1% GlutaMAX [Gibco]) was added to the cells. The suspension was centrifuged for 5 minutes at 400 g at room temperature. The supernatant was removed, the pellet was resuspended in 4 ml complete RPMI, and the cells were incubated for an additional 20 minutes at 37 °C in the dark.
Following the second incubation, the cells were centrifuged again for 5 minutes at 400 g at room temperature and resuspended in complete RPMI medium at the concentration required for plating. Finally, CFSE-labeled cells were analyzed by flow cytometry to confirm successful staining.
Detection of Peripheral Blood Mononuclear Cell Proliferation
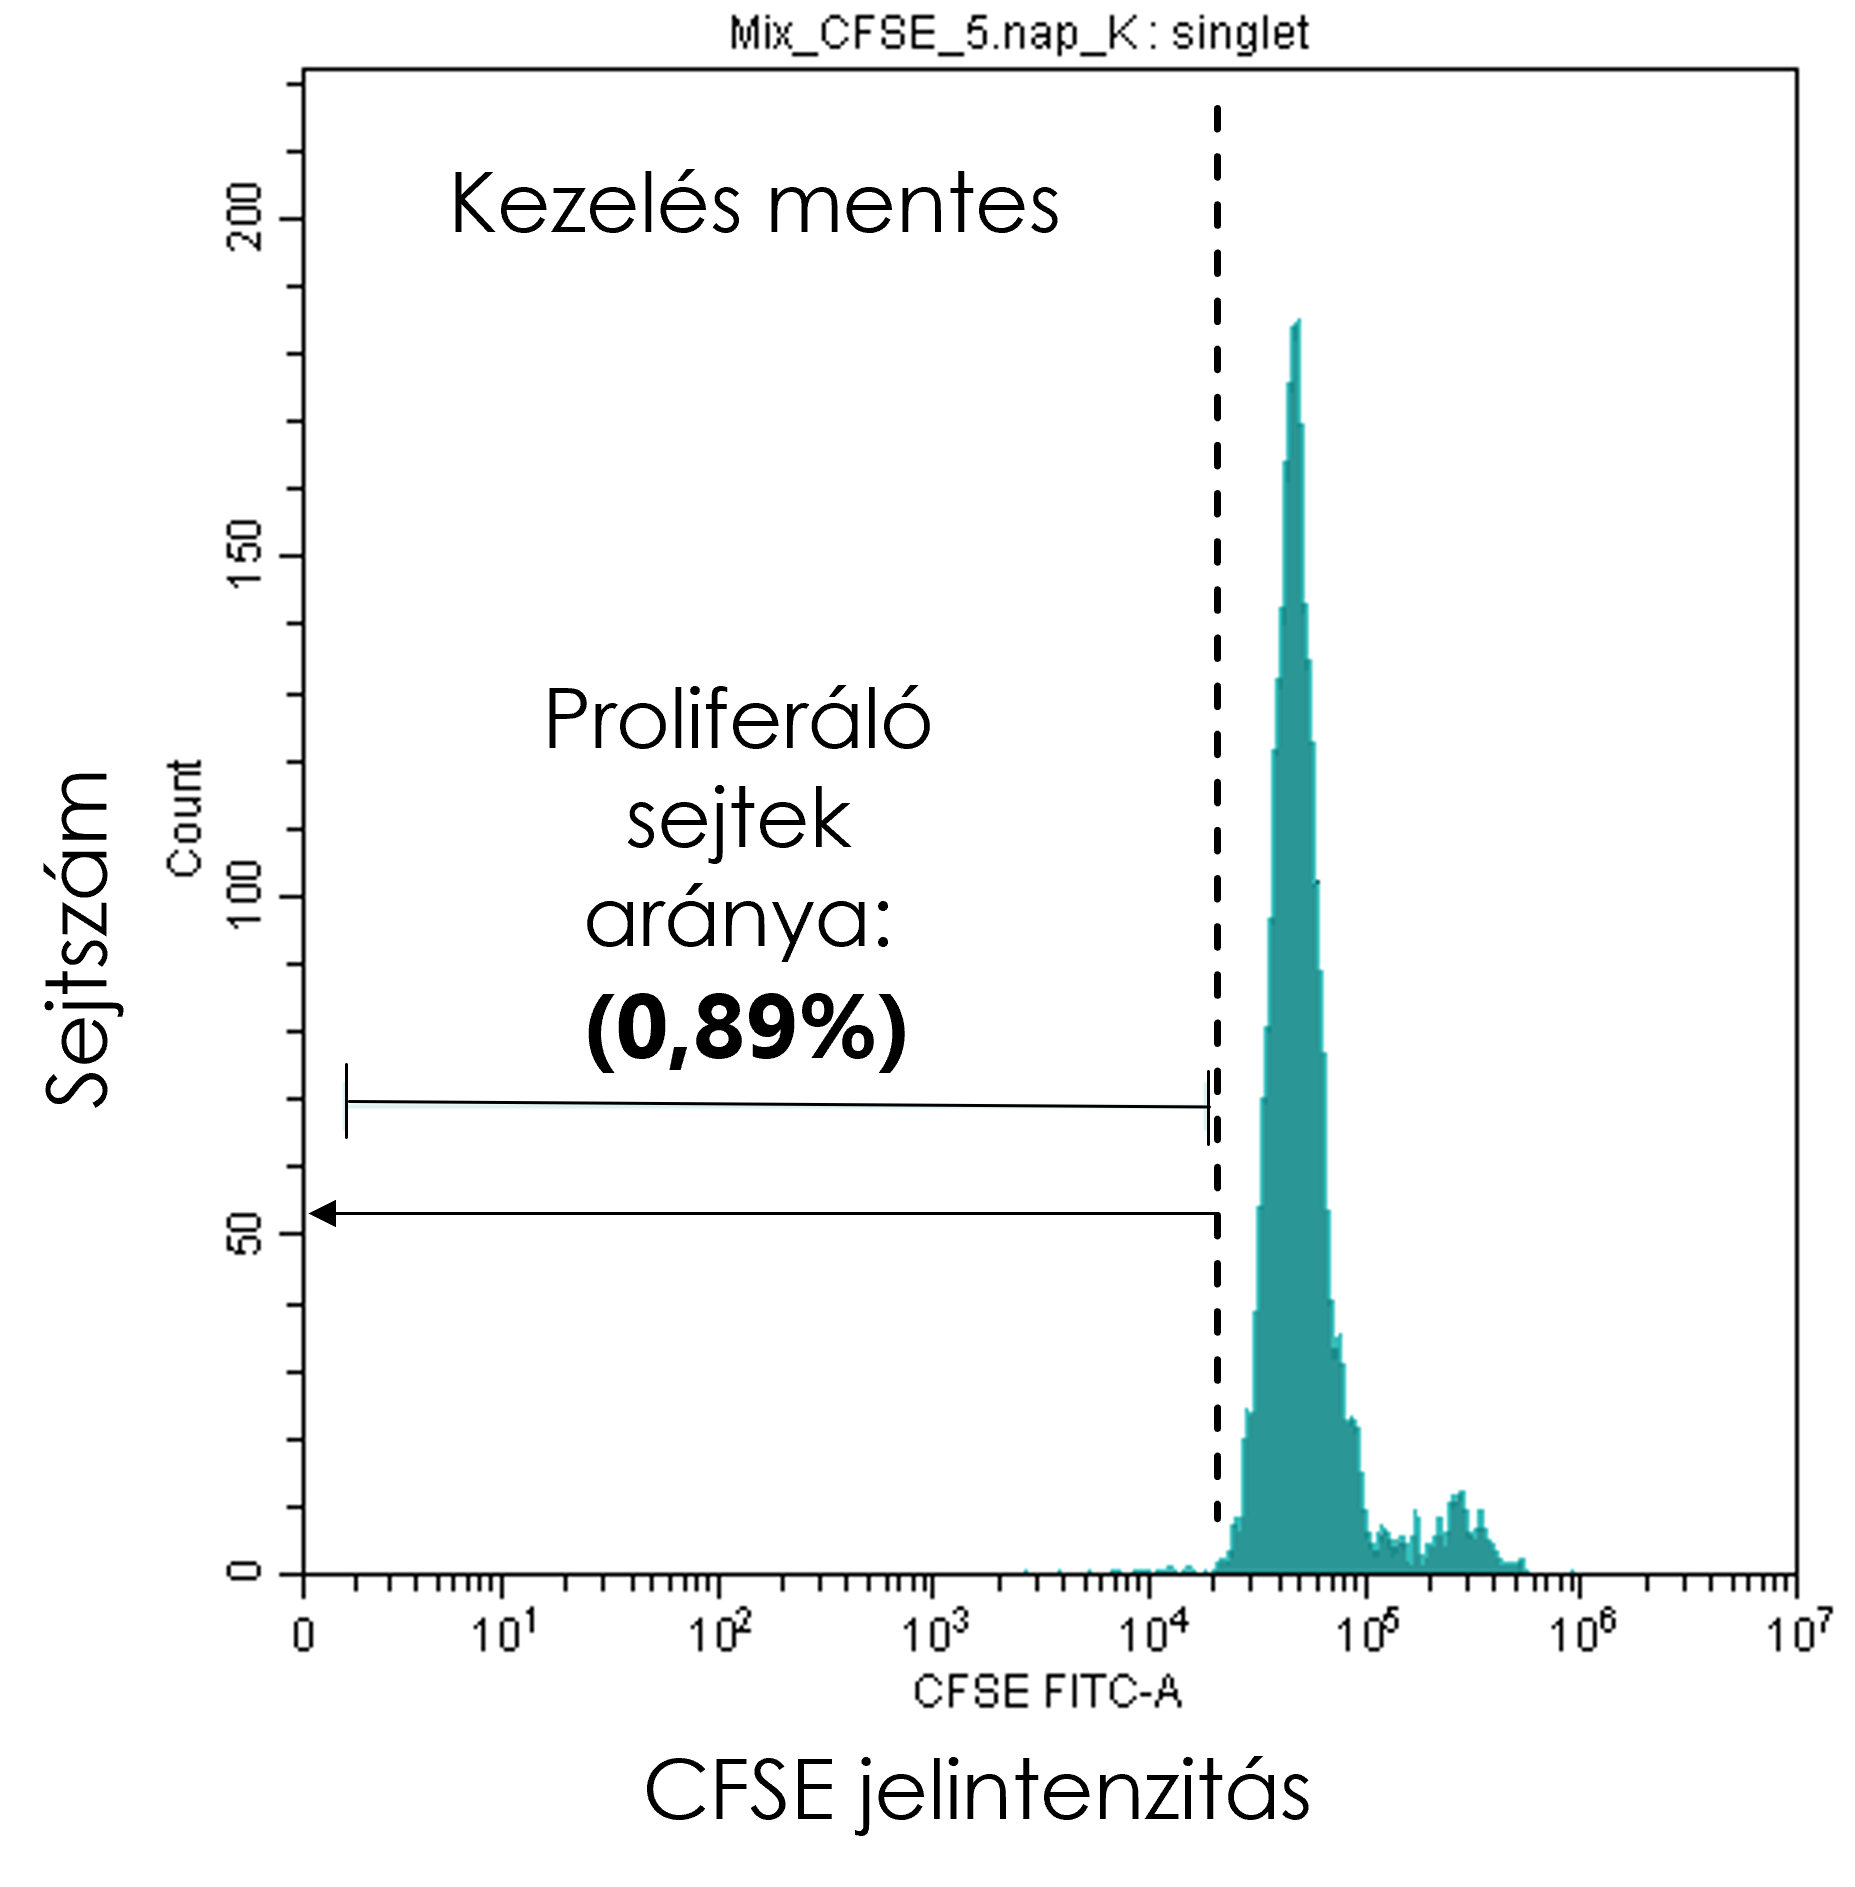
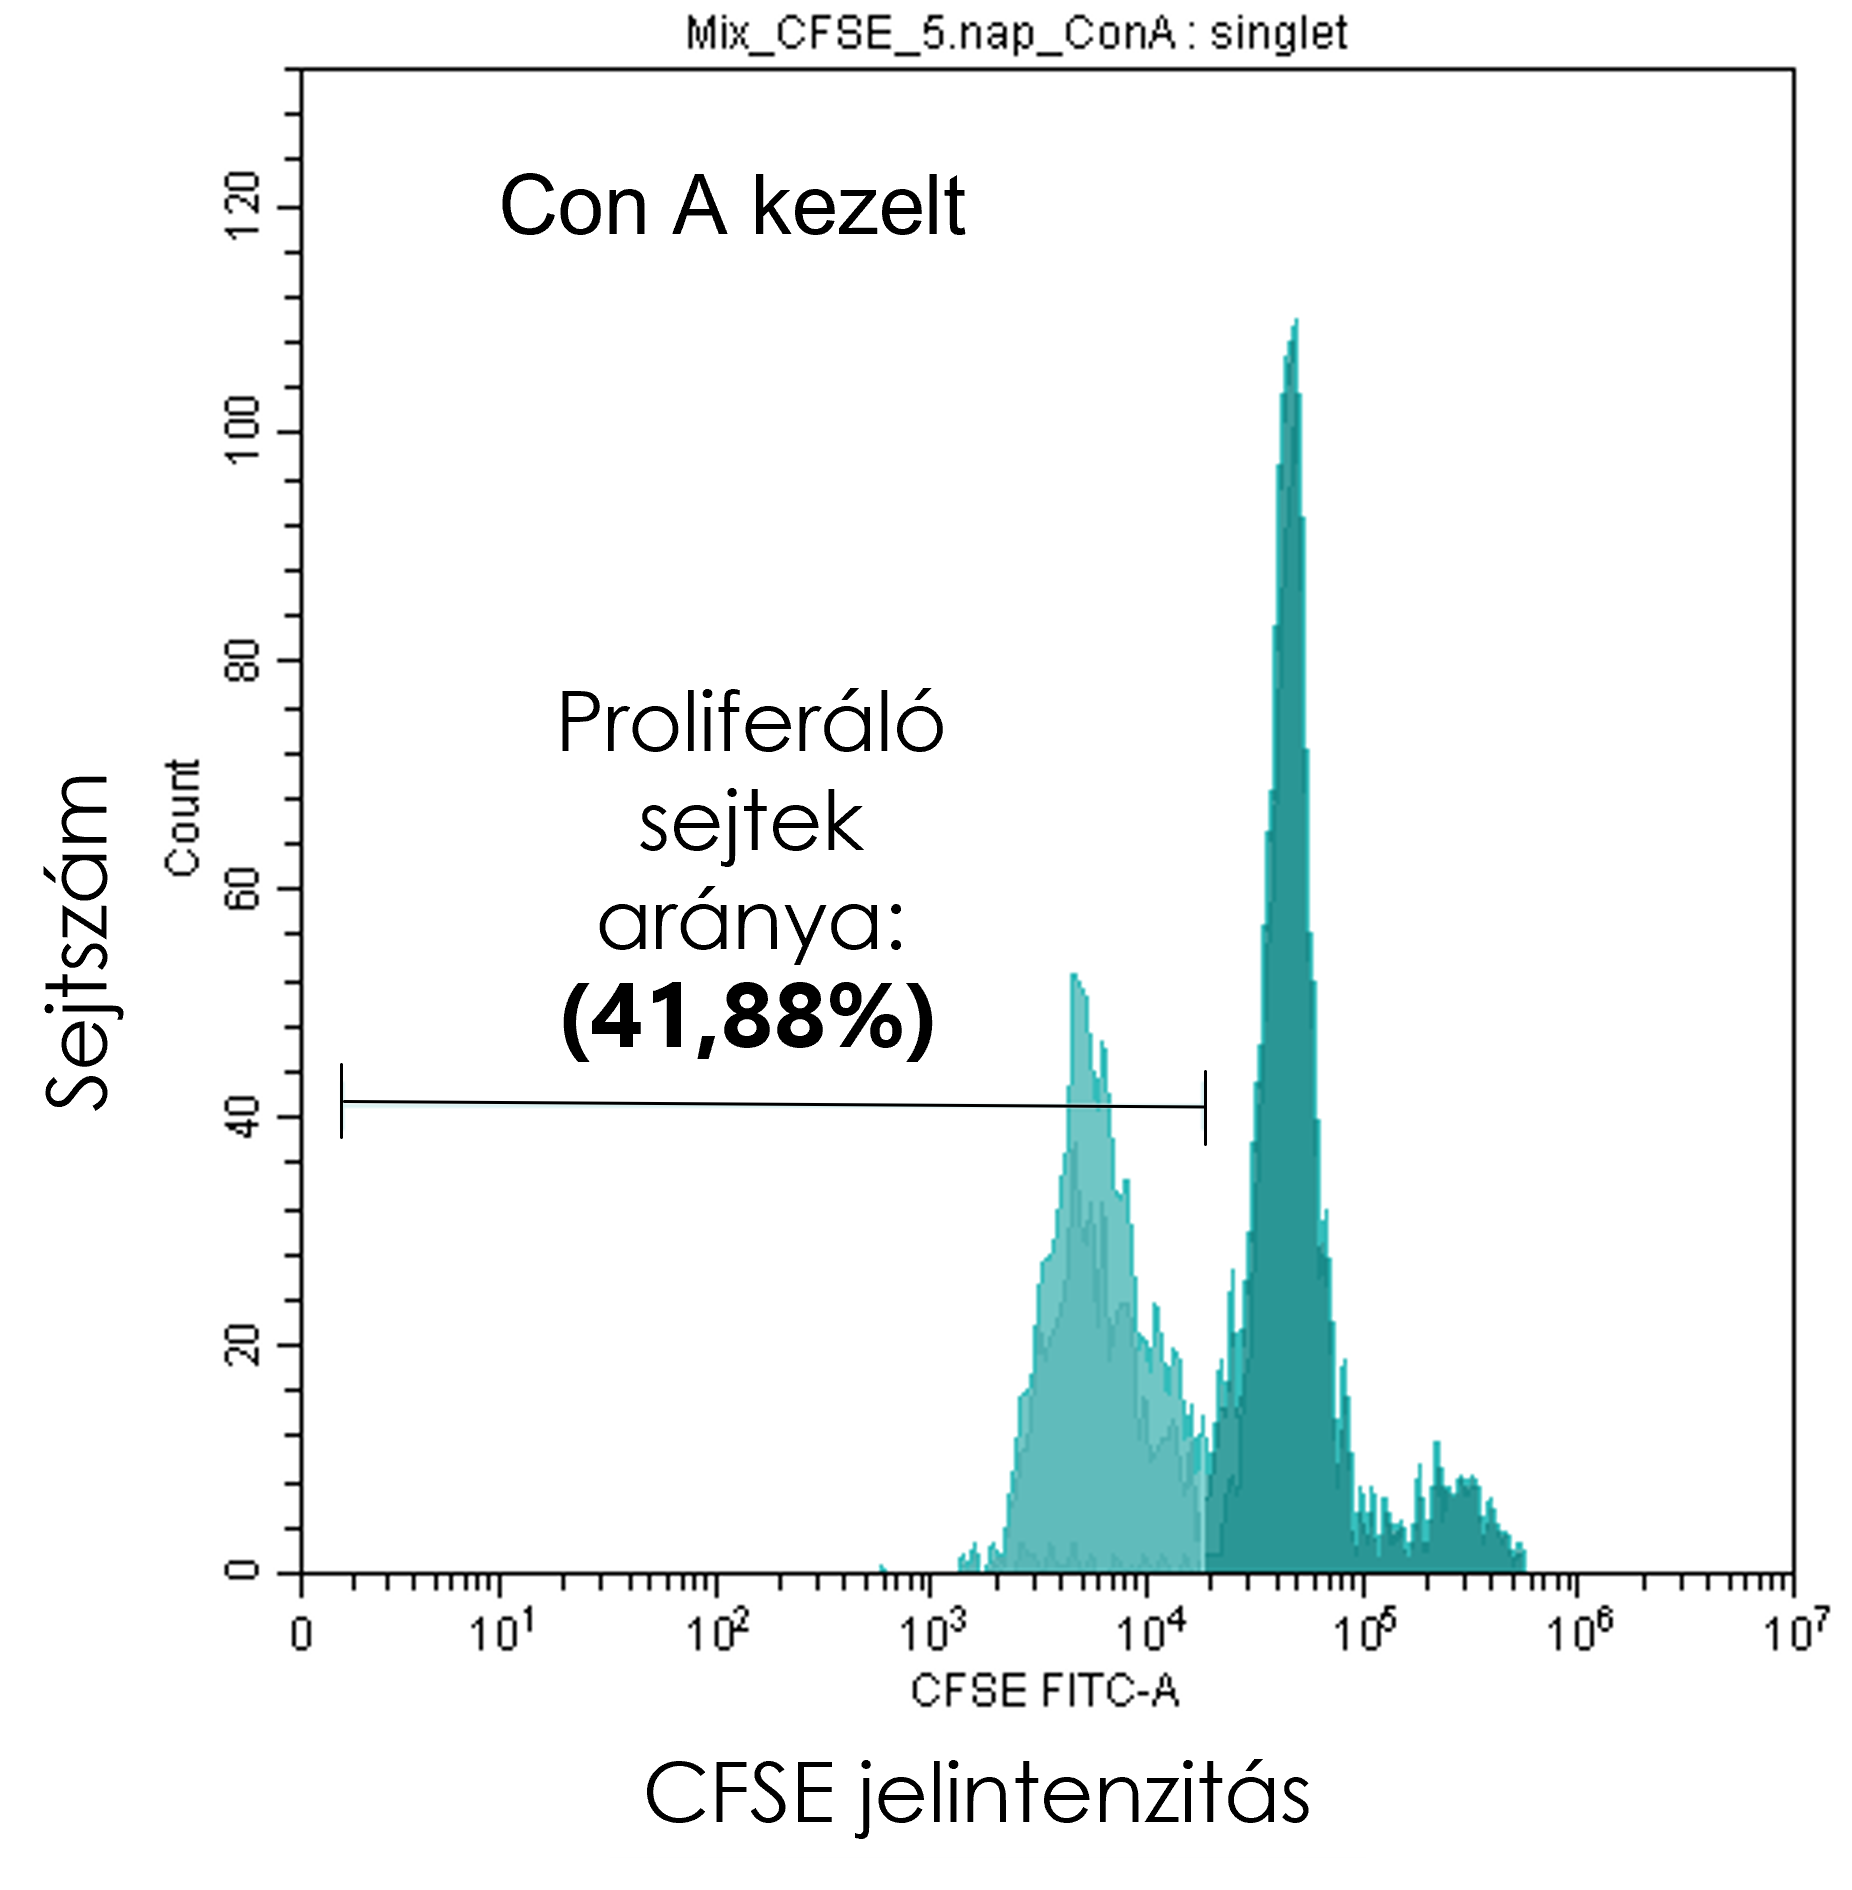
After the predetermined incubation period, cells were counted, and lymphocytes, proliferating cells, and singlets were gated on the dot plots as described above. In CytExpert software (Beckman Coulter), the “histogram” display mode was selected, in which the cell count (y-axis) was plotted against CFSE signal intensity (x-axis).
First, an untreated control sample was used to define the P1 region, covering the x-axis from the initial CFSE peak toward decreasing signal intensities. Each sample was then evaluated based on this P1 region to determine the proportion of proliferating singlet cells showing reduced CFSE intensity, indicating the fraction of cells that had undergone division.
The resulting percentages were plotted and analyzed using GraphPad Prism 9.1.2 (GraphPad).
Inhibition of Peripheral Blood Mononuclear Cell Proliferation by Mesenchymal Stem Cells
For each experiment, the mesenchymal stem cell (MSC) line available in the laboratory at the time—previously seeded and expanded over the preceding days—was used. The required number of MSCs was calculated based on the number of PBMCs to be co-cultured. The culture medium (DLH; DMEM Low Glucose (Gibco) supplemented with 5% human platelet lysate (HPL), 0.01% Gentamicin (Gibco), and Heparibene Na 25000 injection at a final concentration of 1.5 U/mL (Ratiopharm)) was aspirated, and the cells were washed once with PBS (Gibco) to remove any residual medium. TrypLE (Gibco) was then added in a volume appropriate for the culture vessel. Detachment of MSCs was accelerated by incubation at 37 °C. Cell detachment was monitored under a light microscope. Once the cells had detached, the enzymatic reaction was stopped by adding M2 medium (500 mL HBSS (Gibco), 2% HPL, 0.01% Gentamicin, and Heparibene Na 25000 injection at a final concentration of 1.5 U/mL). The cell suspension was transferred to a 15 mL centrifuge tube, and an aliquot was used to determine cell number by flow cytometry (FACS). The remaining cells were centrifuged at 400 g for 7 minutes at room temperature. The supernatant was discarded, the pellet was resuspended, and the cells were adjusted to the required concentration in DLH medium.
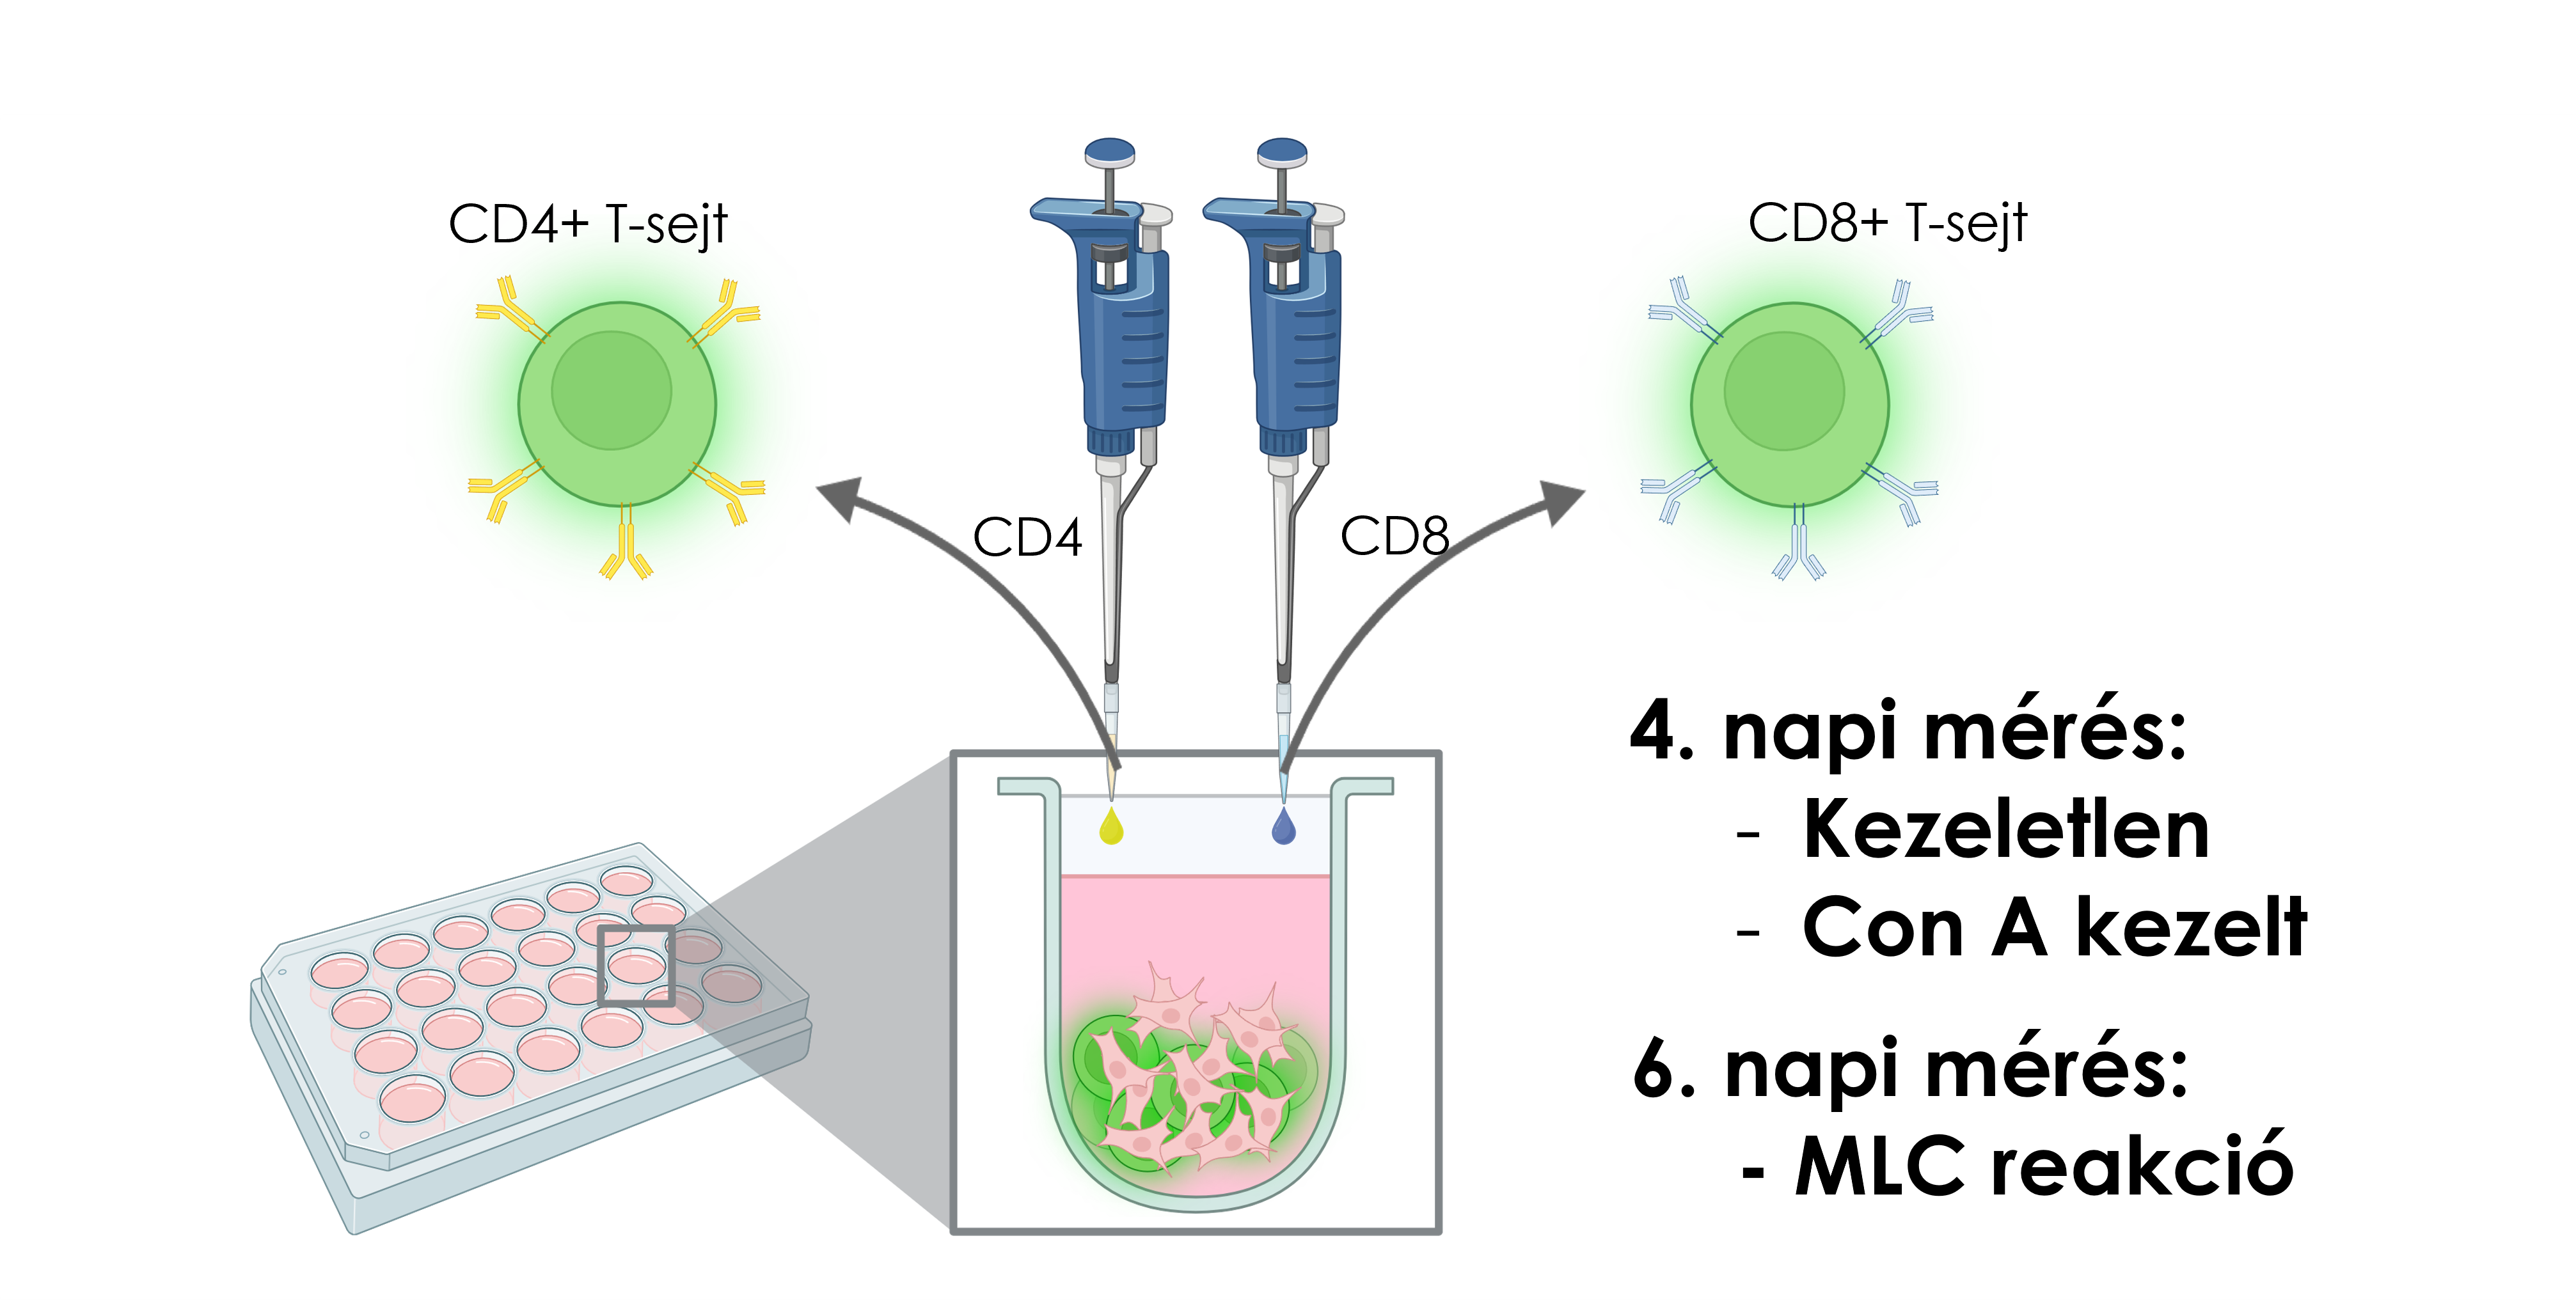
According to the experimental design, MSCs and CFSE-labeled PBMCs (as described above) were seeded into 96-well culture plates. When both cell types were added to the same well, they were pipetted in rapid succession to minimize time differences. A total volume of 200 µL medium was used per well. Con A diluted 1:10 in PBS was added at 0.8 µL per well, resulting in a final concentration of 2 µg/mL. Cells were checked under a light microscope, then incubated at 37 °C in a humidified incubator with 5% CO₂ for the duration of the experiment.
After the incubation period, the cells were stained with CD markers and analyzed by flow cytometry.
CD Marker Staining Protocol
For each sample, 1 µL of antibody or antibody mix was added per sample regardless of the cell number (up to 1 × 10⁶ cells). The cells were incubated for 20 minutes at room temperature in the dark. Following incubation, samples containing fewer than 0.5 × 10⁶ cells were diluted fivefold with PBS, and subsequently analyzed by flow cytometry.
Flow cytometer: CytoFLEX (Beckman Coulter)
Software: CytExpert (Beckman Coulter)
Antibodies used:
-
anti-human CD4-APC/Cy7 (BioLegend)
-
anti-human CD8-APC (ImmunoTools)
-
anti-human CD16-PE/Cy7 (BioLegend)
-
anti-human CD8-PE/Cy7 (BioLegend)
-
anti-human CD20-PE (BioLegend)
-
anti-human CD56-APC (ImmunoTools)