1. MAIN
The page contains many links that lead outside of semmelweis.hu addresses. Please use the page and follow other links at your own risk. Contact Dr. Christos Chinopoulos for inquiries and more information.
The present website outlines the methodology for measuring mitochondrial ADP-ATP exchange rate mediated by the adenine nucleotide translocase (ANT), originally published in: Biophys J. 2009 Mar 18;96(6):2490-504. doi: 10.1016/j.bpj.2008.12.3915, entitled “A Novel Kinetic Assay of Mitochondrial ATP-ADP Exchange Rate Mediated by the ANT” by Christos Chinopoulos, Szilvia Vajda, László Csanády, Miklós Mándi, Katalin Mathe and Vera Adam-Vizi.
The method can be applied not only in isolated mitochondria, but also permeabilized cells, tissue homogenates and ANT expressed in liposomes.
An improved calibration step of this method has been published in Methods Enzymol. 2014;542:333-48.
Follow the numbered tabs. The ‘core’ of the method is outlined in the Buffers, chemicals, Kds determination of ADP, ATP to Mg2+, and Conversion of free Mg2+ to ATP. However, it is advisable to go through all of the links, if you wish to understand what you will be actually doing.
Here you can also find a link pointing to work related to ANT1 as a voltage sensor of the mitochondrial permeability transition.
2. Mitochondria: adenine nucleotide transport basics
The adenine nucleotide translocase (ANT) catalyzes the reversible exchange of ADP for ATP with a 1:1 stoichiometry across the inner mitochondrial membrane. It is the most abundant among mitochondrial carrier family proteins, and in the heart it accounts for as much as 10% of all inner mitochondrial membrane proteins (Nury et al., 2006), (Pebay-Peyroula and Brandolin, 2004). In humans, there are 4 known isoforms (Palmieri, 2004), (Dolce et al., 2005), all encoded by nuclear DNA (Dahout-Gonzalez et al., 2006), (Nury et al., 2006).
For an exhaustive assessment regarding adenine nucleotide exchange through the ANT, the reader is referred to a review by THE authority of the field, Prof. em. Martin Klingenberg, entitled “The ADP and ATP transport in mitochondria and its carrier“.
If the reader is more interested in historical aspects regarding the elucidation of ADP-ATP exchange by the ANT, see “Wanderings in bioenergetics and biomembranes“, also by M. Klingenberg.
3. Current method: concept conceived by others
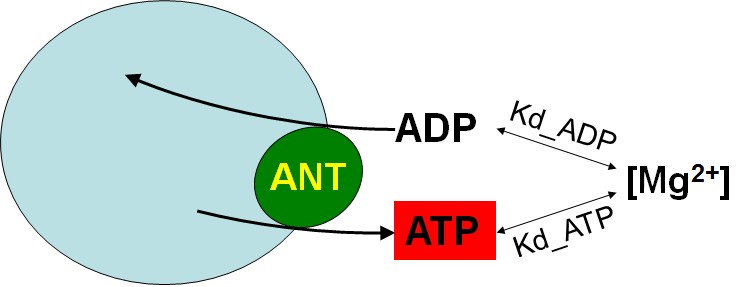
The current method exploits the differential affinity of ADP and ATP to Mg2+ (Kd_ADP and Kd_ATP, respectively). The rate of ATP appearing in the extramitochondrial medium following addition of ADP to energized mitochondria, is calculated from the measured rate of change in free extramitochondrial [Mg2+] reported by the membrane-impermeable 5K+ salt of the Mg2+-sensitive fluorescent indicator, Magnesium Green (MgG), using standard binding equations. The assay is designed so that the ANT is the sole mediator of changes in [Mg2+] in the extramitochondrial volume, as a result of ADP-ATP exchange. The principle is depicted in the cartoon below:
Although it may look deceptively simplistic, it is a bit more complex than that. Full details are given under ‘Conversion of free Mg2+ to ATP‘.
The concept regarding measuring free [Mg2+] as a means to provide an index of changing ATP concentration has already been exploited by others:
– Leyssens et al (1996) from the group of Michael R Duchen have used MgG to demonstrate the relationship between mitochondrial state, ATP hydrolysis and [Mg2+]i in isolated rat cardiomyocytes.
– Even earlier, Silverman et al (1994) from the group of Michael D Stern used Mag-Indo-1 (another fluorescent dye responding to free [Mg2+]) to show that fluctuations in free [Mg2+] correlated inversely to ATP levels, associated with changes in oxygenation and contracture, in rat cardiomyocytes.
– Even before Silverman et al, Levy et al (1988) from the group of Robert E London developed fluorinated derivatives of the chelator o-aminophenol-N,N,O-triacetic acid (APTRA) for use as 19F NMR indicators of free cytosolic magnesium concentration, and then Murphy et al (1989) used them as a means of following changes in [ATP] in the ischemic rat heart.
I emphasize that the novelty of the methodology outlined in this website and in the original publication is that we could convert the changes in free [Mg2+] to changes in [ATP], using standard binding equations. Thus, we developed a quantitative method for measuring ATP output from mitochondria. Since the ANT exchanges ADP for ATP in a 1:1 format, the rate of ATP efflux from polarized mitochondria is the rate of ADP-ATP exchange by the ANT.
4. Other methods: problems with luciferase
Several other methods for determining the ATP-ADP steady-state exchange rate mediated by the ANT have been described in the past.
Some of these directly measure ADP and/or ATP by 1) thin-layer chromatography (Pedersen and Catterall, 1979), 2) high-performance liquid chromatography (Hartwick and Brown, 1975), or 3) using radioactive nucleotides (Duee and Vignais, 1969). Others employ coupled reactions which yield an end-product that can be detected either fluorimetrically by 4) monitoring the reduction of NADP+ which occurs in the presence of glucose, hexokinase, glucose-6-phosphate dehydrogenase and effluxed ATP (Williamson and Corkey, 1979), (Passarella et al., 1988) or 5) luminometrically, detecting chemiluminescence upon ATP-dependent oxidation of luciferin, catalyzed by firefly luciferase (Lemasters and Hackenbrock, 1979). Furthermore, there are techniques which employ fluorescent derivatives of nucleotides (method 6) in order to estimate the rate of release of the fluorescent molecule upon ANT-mediated exchange for ADP (Block et al., 1986).
To complement the above functional assays, the amount of ANT protein can be estimated using (method 7) a fluorescent derivative of atractyloside (Boulay et al), or, exploiting the 1:1 stoichiometry of binding of the inhibitor to the translocase, by (method 8) stepwise titration of State 3-mitochondria with cATR until respiration is completely inhibited (Schonfeld, 1990).
Among the aforementioned methodologies, only methods 4, 5 and perhaps 6 are on-line measurements, while the rest are end-point assays (although a satisfactory time resolution can be obtained using a large number of samples as detailed by (Brandolin et al., 1990). Methods 1 and 2 require expertise in specialized equipment, while method 3 requires handling of radioactive material, conditions which may render these methods cumbersome to use. However, it must be noted that these are all very sensitive assays which require small amounts of mitochondrial protein. Methods 6 and 7 rely on materials which are not commercially available, and are therefore not appealing to the broader scientific community.
Method 5 (luciferase method), if used as an on-line method, suffers from several drawbacks. First, the lack of constant proportionality between ATP concentration and luminescence, caused by product inhibition of the luciferase reaction by oxyluciferin, renders this method at best semi-quantitative. Second, for reliable estimation of the kinetics of ATP formation, the endogenous ATP concentration prior to the assay has to be determined. Third, the required use of a low ionic strength medium and room temperature restricts experiments to conditions which are nowhere near physiological. Fourth, the necessity to maintain [O2] below 50 mM, needed to avoid significant drifts in luminescence, adds extra effort to any application of this method. Nevertheless, some of the disadvantages of this method have been overcome by various modifications (Wibom et al., 1990). Overall, in my personal opinion, please do not use this method for quantitating ADP-ATP exchange rate mediated by the ANT.
Method 4 has two disadvantages. First, there are two mediating coupled reactions which may affect stoichiometry through product (glucose-6-phosphate) inhibition of hexokinase. Second, the measured signal -NADP(H) autofluorescence- precludes the simultaneous measurement of this mitochondrial parameter, plus the stimulation of mitochondrial respiration by addition of ADP affects the NAD(P)H steady state. For a comprehensive appraisal of methods to measure ATP-ADP exchange rates in mitochondria and reconstituted systems, the reader is referred to the review by Martin Klingenberg (Klingenberg, 2008).
The advantage of the method described in this webpage is that it provides kinetic information at a high acquisition rate while it does not suffer from the drawbacks described for methods 4, 5 and 6. In addition, our method can be combined with simultaneous recording of further mitochondrial parameters using other types of fluorescent dyes. As an example, MgG fluorescence has been used to report changes in intracellular [ATP] in cardiomyocytes combined with simultaneous recording of NAD(P)H autofluorescence and mitochondrial membrane potential using JC-1 (Leyssens et al., 1996). Of course, David G Nicholls would (rightfully) give you a lecture as of why never to use JC-1 for measuring mitochondrial membrane potential.
5. Affinity of ions to ADP, ATP
The core of the methodology relies on the differential affinity of Mg2+ for ADP and ATP. It is thus important to dwell a bit on this.
Nucleotides and ions exhibit affinities to each other. This is depicted in the figure below:


The affinity constants between the nucleotides and ions are variable, and highly dependent on extraneous factors (pH, temperature, ionic strength, etc). Furthermore, the presence of multiple ions or nucleotides complicates the complexation (no pun intended) and chelation of the nucleotides with the ions.
I only wish to emphasize that the user of this method must keep the system free from fluctuations of extraneous factors, and make sure that the buffers are not contaminated with other nucleotides and/or ions. For example, please do not use creatine or creatine phosphate containing buffers and make sure that your chemicals are not contaminated with Ca2+, Ba2+, Mn2+, Sr2+ or other metals. Exact composition of the buffers is given under Buffers, chemicals.
6. Why Magnesium Green?
The method relies on the fluorimetric detection of free Mg2+. There are a few fluorophores with enhanced affinity for Mg2+. These are:
1) Mag-indo-1. Not preferred, discontinued item by most major vendors.
2) Mag-fura-2, tetrapotassium salt. The great advantage of this dye is that it is ratiometric, thus it does not suffer from signal drifts (among other things). The disadvantage of Mag-fura 2 is that its affinity constant (Kd) for Mg2+ is around 1.9 mM, which makes it a bit insensitive for measuring ADP-ATP exchange if the nucleotides are in the low millimolar range.
3) Mag-fluo-4, potassium salt. I don’t suggest it for measuring ADP-ATP exchange rate in mitochondria because its Kd for Mg2+ is 4.7 mM, thus very insensitive to alterations of ADP and ATP in the low millimolar range.
4) Magnesium Green, pentapotassium salt (MgG). This would be my choice because of the low Kd for Mg2+, around 0.9 mM. Unfortunately, it is a single excitation (~505 nm)/single emission (~535 nm) dye, thus the user may experience signal drifts. Under the ‘Under the hood‘ advices I suggest a few tricks to alleviate these drifts.
CAUTION: please note that all Mg2+-sensitive dyes also bind Ca2+. The Kd of Mag-fura-2 for Ca2+ is ~ 20-50 microM, and that of MgG is ~ 6 microM. This means that if you choose MgG, you must keep [Ca2+] to less than 1 microM.
7. Buffers, chemicals
‘ANT buffer’
| M.W. | final concentration (mM) | 1000 ml | Origin | |
| KCl | 74.55 | 8 | 596.4 mg | 104938 MERCKMillipore do NOT use other type of KCl |
| K-gluconate | 234.25 | 110 | 25.767 gr | G4500 SIGMA |
| NaCl | 58.44 | 10 | 584.4 mg | S9888 SIGMA |
| Hepes (free acid) | 238.3 | 10 | 2.383 gr | 54457 SIGMA |
| K2HPO4 | 174.18 | 10 | 1.7418 gr | 17835 SIGMA |
| EGTA (K+ salt) | 380.35 | 0.015 | 5.7053 mg | 03779 SIGMA |
| BSA (FA-free) | – | 0.5 mg/ml | 500 mg | A6003 SIGMA |
| Mannitol | 182.2 | 10 | 1.822 gr | M9546 SIGMA |
| pH= 7.25 (using KOH-ultrapure or HCl-ultrapure) | – | – | KOH: P5958 SIGMA (make a 5N stock) HCl: 339253 SIGMA (make a 5M stock) |
Just before the experiment, add MgCl2. For isolated mitochondria, use 1 mM final concentration; for permeabilized cells, 1.5 mM (unless you calibrate the magnesium green signal, or determine Kds of ADP or ATP for Mg2+, see under ‘Kds determination of ADP, ATP to Mg2+‘).
MgCl2: M1028 SIGMA (1 M stock solution).
Do NOT keep buffer containing MgCl2 for more than one day!
Other chemicals required, depending on the experimental scheme:
| final concentration | Stock | Solvent | Origin | |
| Magnesium Green, pentapotassium salt | 1.1 microM | 1.1 mM | Water (add 993 microl of water in 1 mg vial); make at least 10 aliquots; store in -20 oC |
M3733 Thermo Fisher |
| Digitonin | custom | ≥2.5 mM | DMSO. Aliquot and keep in -20 oC |
custom; best is from Wako Chemicals: Cat-no: 043-21371 |
| Succinate | 5 mM | 0.5 M | Water, pH 7.0-7.2 (KOH) | 14080 SIGMA |
| Glutamate | 5 mM | 1 M | Water, pH 7.0-7.2 (KOH) | 49449 SIGMA |
| a-Ketoglutarate | 5 mM | 1 M | Water, pH 7.0-7.2 (KOH) | 75890 SIGMA |
| Malate | 5 mM | 0.5 M | Water, pH 7.0-7.2 (KOH) | 02288 SIGMA do NOT use other type of malate |
| Pyruvate | 5 mM | 1 M | Water, pH 7.0-7.2 (KOH) | P2256 SIGMA |
| EDTA | custom; no less than 10 microM |
0.5 M | – | 03690 SIGMA |
| BeSO4*4H2O | see below | 0.2 M | Water; do not adjust pH | 14270 SIGMA |
| NaF | see below | 0.5 M | Water; do not adjust pH | S7920 SIGMA |
| Na3VO4 | preparation needed see below |
25 mM | preparation needed see below |
450243 SIGMA |
| Safranin O | see below | 1 mM | Water; store at RT; do not shake, allow precipitate to form; always take from the top; do not adjust pH |
S2255 SIGMA |
| SF6847 | Custom; maximum concentration is 250 nM for complete depolarization of isolated mitochondria |
1 mM | Ethanol | BML-EI215 ENZO Life Sciences |
| Ap5A | 50 microM | 0.1 M | Water; do not adjust pH | D4022 SIGMA |
| carboxyatractyloside | 1 microM | 2 mM | Water; do not adjust pH | 216201 MERCK Millipore |
| valinomycin | 5 nM | 1 mM | Ethanol | V0627 SIGMA |
| ADP (K+ salt)* | custom | 0.2 M | Water. pH between 6.2 and 6.9. Freeze to -20 oC in aliquots. Aliquots can be reused up to 3 times. |
117105 MERCK Millipore do NOT use other type of ADP |
| ATP (diNa+ salt)* | custom | 0.2 M | Water. pH between 6.2 and 6.9. Freeze to -20 oC in aliquots. Aliquots can be reused up to 3 times |
A7699 SIGMA do NOT use other type of ATP |
| EGTA solution | custom | 0.2 M | Water; pH to 7.0 | 03779 SIGMA |
| oligomycin | 10 microgr/ml | 10 mg/ml | Ethanol | O4876 SIGMA |
Preparation of sodium orthovanadate (Na3VO4) and beryllium trifluoride (BeF3–): A 25 mM Na3VO4 solution is prepared in distilled water (>17 megaOhm resistance). The pH of the solution is adjusted to 8.7 with HCl, upon which it turns yellow. This solution is boiled until it turns colorless and cooled to room temperature. The pH is reassessed, and readjusted to pH 8.7 with HCl, upon which the solution turns yellow again. This cycle of boiling until colorless and readjusting the pH is repeated until the solution remains colorless at pH 8.7. Finally, the solution is brought up to the initial volume with distilled water and stored in aliquots at -20 °C. This treatment removes all decavanadate ions present in the Na3VO4 solution, which induces mitochondrial membrane depolarization and inhibition of oxygen consumption (Aureliano and Crans 2009). Orthovanadate inhibits the oxidation of only disrupted mammalian mitochondria (Byczkowski et al. 1979).
Likewise, fluoroberyllium nucleoside diphosphate complexes inhibit only the exposed F1F0-ATPase (Issartel et al. 1991). BeSO4 and NaF are prepared as aqueous stock solutions of 0.2 M and 0.5 M, respectively, and kept at +4 °C for several years. BeF3– is formed immediately in solution upon mixing of BeSO4 and NaF, provided that NaF is in excess in the working solution. BeF3– is formed immediately in solution upon mixing of 2 microliters of 0.2 M in a 2 ml cuvette volume containing the buffer of your choice (i.e. 200 micromolar BeSO4 final concentration) and 20 microliters of 0.5 M NaF, (i.e. 5 millimolar NaF final concentration). As such, final concentration of BeF3- will be 200 micromolar.
Vanadate, beryllium and fluoride salts are highly toxic to tissues and to the environment, and thus require proper handling and disposal. The combination of orthovanadate and BeF3– will inhibit kinases, mutases, phosphatases, and ATPases (Ray et al. 1990; Climent et al. 1981). However, some kinases, such as pyruvate kinase, will remain uninhibited (Lord and Reed 1990). In this respect, upon permeabilization of the cells one has to totally separate pyruvate kinase from its substrate, phosphoenol pyruvate, i.e. there must be no glucose present in the medium prior to permeabilization, and a few minutes lag time must be allowed prior to ADP-ATP exchange rate measurements in order for the remaining reactions by kinases to ‘die-out’.
*Concentration of ADP and ATP stock solutions is corrected by measuring absorbance at 260 nm using an extinction coefficient eM= 15,400 M-1*cm-1.
8. Kds determination of ADP, ATP to Mg2+
The method relies on the quantitative determination of free [Mg2+] in the extramitochondrial medium. Thus, MgG raw fluorescence needs to be calibrated to free [Mg2+] (see step 5). Furthermore, the affinity constants of ADP for Mg2+ and ATP for Mg2+ for the pertaining conditions (composition of the medium, temperature, ionic strength, type of biological material, planetary alignment, etc), must be determined.
Below, an example is presented for calibrating MgG fluorescence to [Mg2+] and determining the affinity constants of ADP for Mg2+ and ATP for Mg2+ (Kd_ADP and Kd_ATP, respectively) for permeabilized cells, using an Oroboros equipped with an O2k-Fluorescence LED2-Module:
Step 1: Resuspend cells in 2 ml of ‘ANT buffer‘ containing 50 μM AP5A, 5 mM NaF, 0.2 mM BeSO4, 25 μM Na3VO4, 1 μM carboxyatractyloside (cATR), 10 μg/ml oligomycin and 50 μM digitonin and add them to a chamber of an Oroboros Oxygraph-2k. Then, add 1.1 mM MgG to the chamber. MgG fluorescence is recorded by the O2k-Fluorescence LED2-Module at a 1 Hz acquisition rate. Use Filter set ‘MgG/CaG’, together with ‘Fluorescence-Sensor Blue’. If you choose to use a conventional fluorimeter, use 505 nm for excitation and 535 nm for emission. MgG has a very high extinction coefficient (75,000 cm-1*M-1, i.e. it is very bright), so rather use a low excitation light intensity. Experiments are performed at 37 oC, or the temperature of your choice. If you use isolated mitochondria, you don’t need to add NaF, BeSO4, Na3VO4, or digitonin. If you use homogenates, you definitely need to add NaF, BeSO4, and Na3VO4, but not digitonin. Wait for signal stabilization.
Step 2: Add 1 μM EGTA (to chelate nominal amount of Ca2+ in the buffer). If you see a drop in MgG fluorescence, add another bolus of 1 μM EGTA. Keep adding boluses of 1 μM EGTA until you see no further drop in MgG fluorescence. Calculate the amount of EGTA that you have cumulatively added. This should be the amount of EGTA that you need to add to all of your buffers in order to minimize Ca2+ contamination. In the same experiment, after the addition of EGTA boluses, add 1 μM EDTA (to chelate nominal amount of Mg2+ in the buffer). If you see a drop in MgG fluorescence, add another bolus of 1 μM EDTA. Keep adding boluses of 1 μM EDTA until you see no further drop in MgG fluorescence. Calculate the amount of EDTA that you have cumulatively added. This should be the amount of EDTA that you need to add to all of your buffers in order to minimize Mg2+ contamination.
If you change buffer composition, you need to perform step 2 again in order to determine how much EGTA and EDTA you need to add in order to eliminate contaminations with Ca2+ and Mg2+. Note that it would be a huge mistake to add millimolar of EGTA and EDTA ‘just to be sure’. The method relies on the quantitative determination of free [Mg2+] in the extramitochondrial medium, plus, the amount of free Ca2+ will also affect the binding of ADP and ATP to Mg2+, see under ‘Affinities of ions to ADP, ATP‘.
Step 3: MgG fluorescence signal is recorded upon stepwise additions of 0.1 mM MgCl2 for a total of 10 additions (blue trace, about 50 sec of recording time per addition). This is shown in the figure below, on the left side of the dashed line.
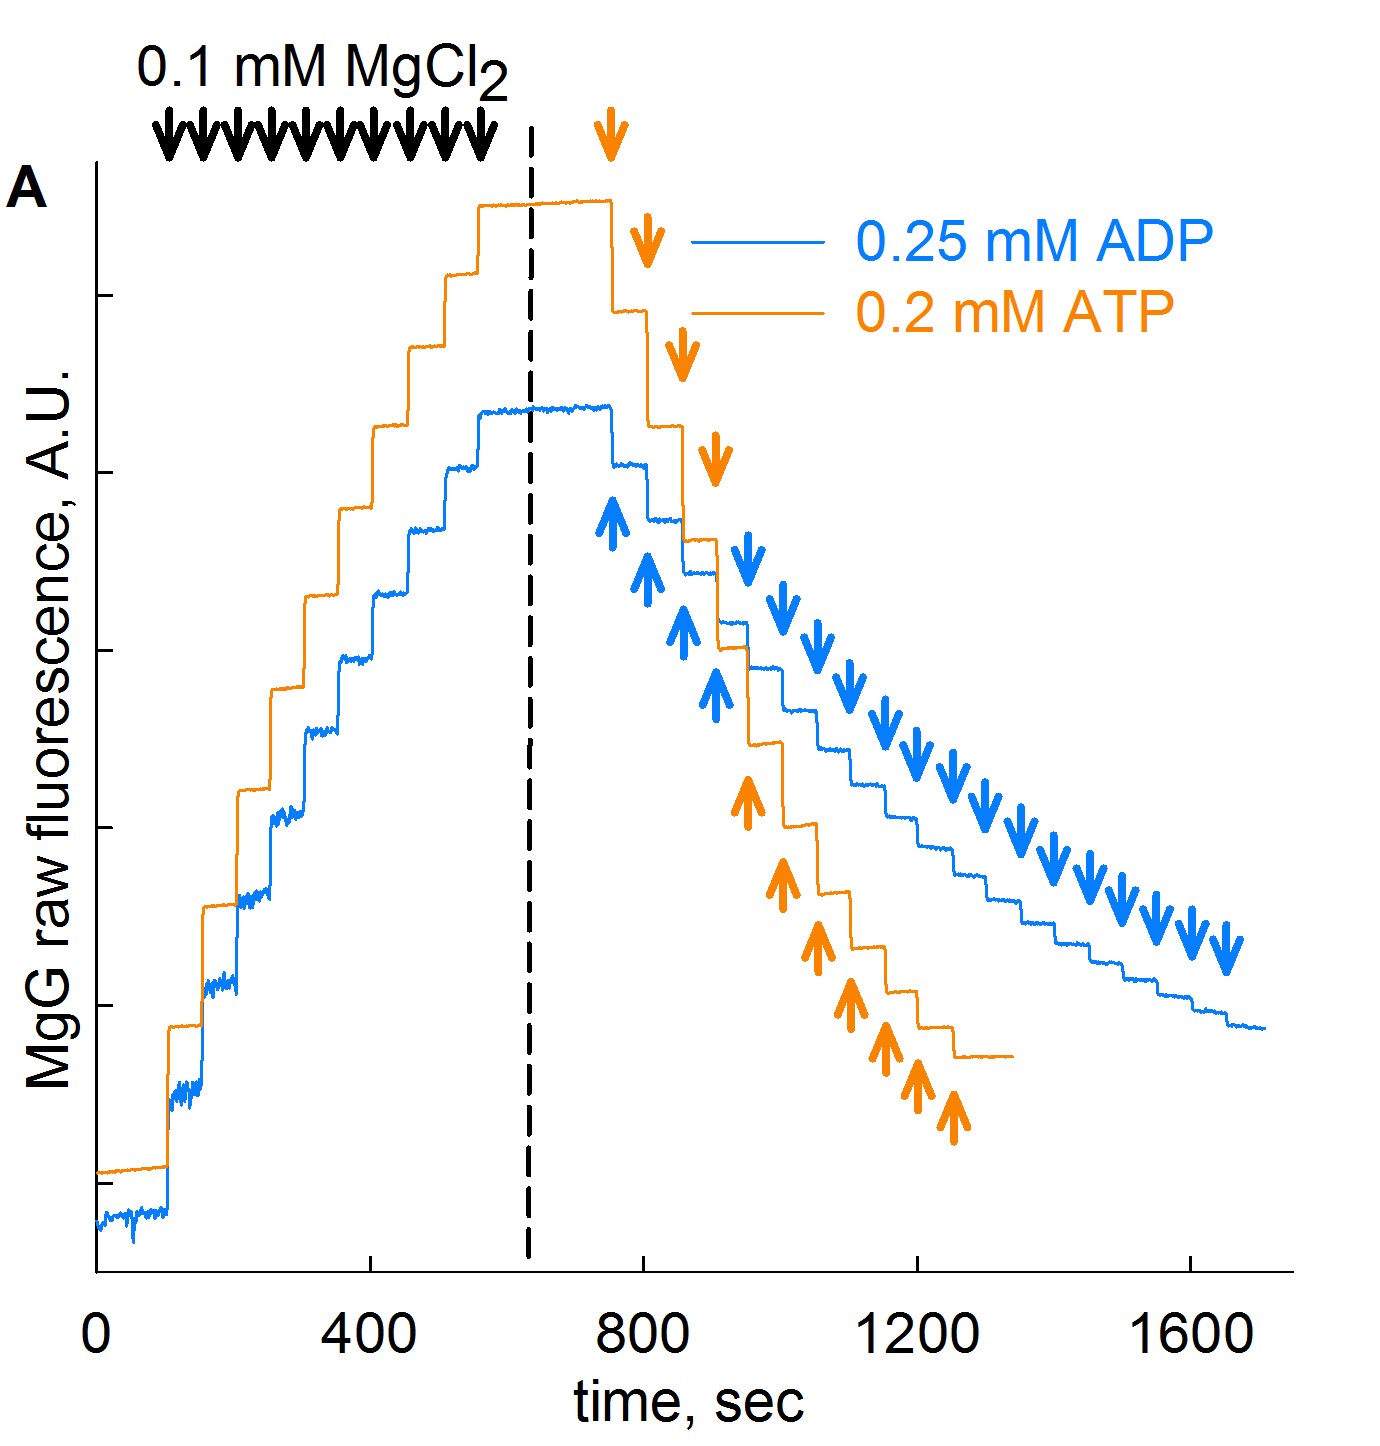
Step 4: Continuing in same cells in the chamber, add 0.25 mM ADP in subsequent steps for a total of 19 steps (blue trace, about 50 sec of recording time per addition). This is shown in figure above, on the right side of the dashed line. Likewise, in a new cell preparation, repeat Steps 1- 4, but with 11 additions of 0.2 mM ATP instead of ADP, also shown in the figure above (orange trace).
Step 5: Convert the MgG signal of both left and right part of the figure shown above to free [Mg2+]. To do this, use this excel file, please ask Christos Chinopoulos for the file: CALIBRATION OF MgG RAW FLUORESCENCE TO [Mg2]-PP.xlsx.
(you can see a screenshot of the excel sheet below, followed by instructions):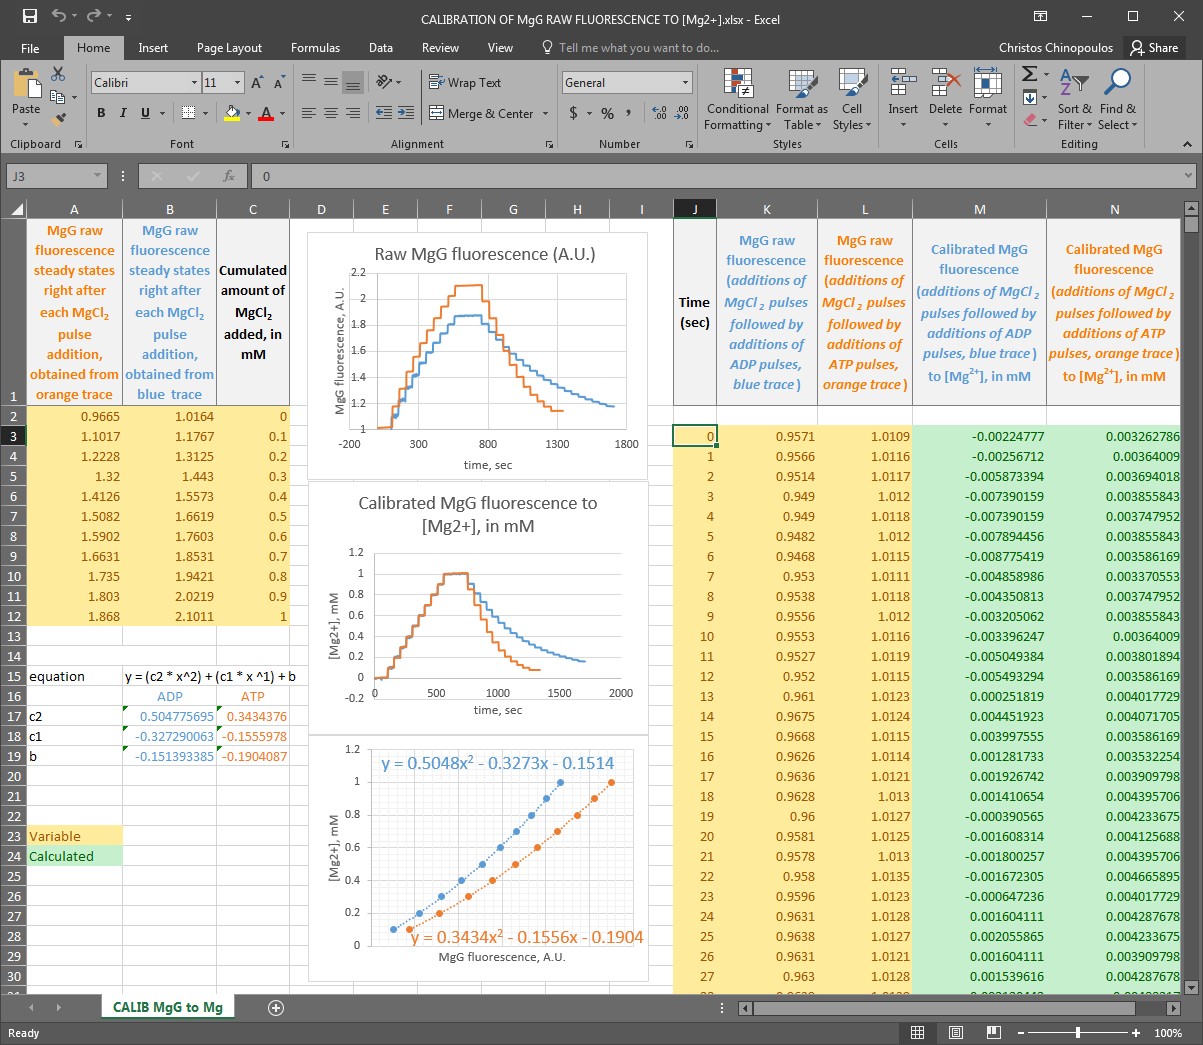
Instructions for using ‘CALIBRATION OF MgG RAW FLUORESCENCE TO [Mg2+].xlsx’ – please ask Christos Chinopoulos for the file
Note: you can only input data (variables) in yellow-colored boxes.
Note: Calculated data appear in green-colored boxes.
The excel sheet is populated with typical data; please replace them with your own.
First: In column J, input the time scale of your MgG traces (in seconds), assuming that the experiments shown in the blue and orange traces were performed simultaneously. If you performed them sequentially, please be exact and make the additions at nearly the exact same times so that you can use the same time scale for both experiments.
Second: In column K, input the MgG raw fluorescence data obtained from the additions of MgCl2 pulses followed by the additions of ADP pulses, as shown in the blue trace.
Third: In column L, input the MgG raw fluorescence data obtained from the additions of MgCl2 pulses followed by the additions of ATP pulses, as shown in the orange trace.
Fourth: In column C, input the cumulated amount of MgCl2 added, in mM.
Fifth: In colum A, input the steady states of MgG raw fluorescence obtained right after each MgCl2 pulse addition, obtained from the orange trace.
Sixth: In colum B, input the steady states of MgG raw fluorescence obtained right after each MgCl2 pulse addition, obtained from the blue trace.
If you have done the above correctly, columns M and N will be populated with the calibrated MgG fluorescence to free [Mg2+]. Column M is the calibrated blue trace (ADP additions after MgCl2 additions), while column N is the calibrated orange trace (ADP additions after MgCl2 additions). Furthermore, in the graph entitled “Calibrated MgG fluorescence to [Mg2+], in mM”, the left and right parts of the blue and orange traces must superimpose, and in the graph entitled “2nd order polynomial fit”, there should be two dotted curves fitting your data indicating how reliable is the calibration of MgG raw fluorescence to free [Mg2+].
If in the graph entitled “Calibrated MgG fluorescence to [Mg2+], in mM”, the left and right parts of the blue and orange traces superimpose, and in the graph entitled “2nd order polynomial fit” the curves ‘fit well’ to your data (i.e. r2> 0.95), it means that you can calibrate MgG raw fluorescence reliably; you can proceed to step 6 in order to determine the affinity constants of ADP for Mg2+ and ATP for Mg2+ (Kd_ADP and Kd_ATP, respectively), for your experimental buffer and conditions.
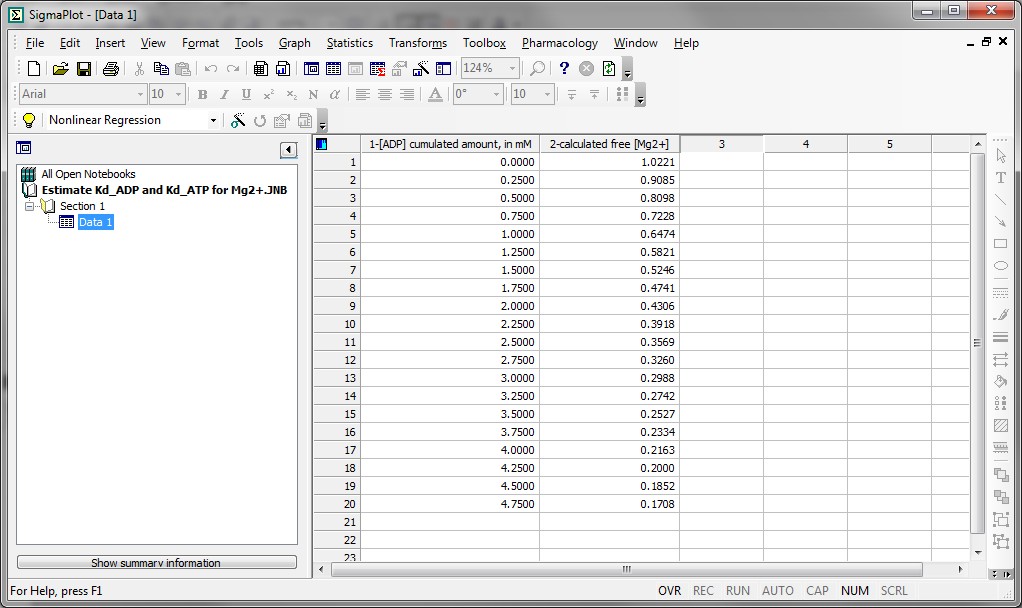
Step 6: The determination of the affinity constants of ADP for Mg2+ and ATP for Mg2+ (Kd_ADP and Kd_ATP, respectively) can be done in SigmaPlot. Gergo and myself have tried very hard to produce an excel sheet for this task, but failed to do so. Below I provide instructions for using a SigmaPlot notebook (jnb file, with screenshots) for determining Kd_ADP and Kd_ATP for Mg2+. This notebook has been generated using SigmaPlot version 11.0, build 11.2.0.5.
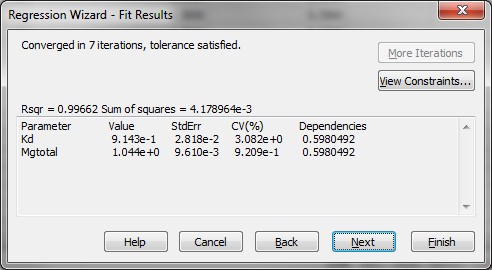
Substep I) In the SigmaPlot notebook, input in column 1 the cumulated amount of ADP added, in mM, and in column 2 the calculated [Mg2+] obtained from the steady states right after each addition of ADP pulse, see screenshot below:
Substep II) Next, click on Statistics -> Non-linear Regression -> Regression Wizard (for SigmaPlot 8 and above, press F5 to get directly to step III)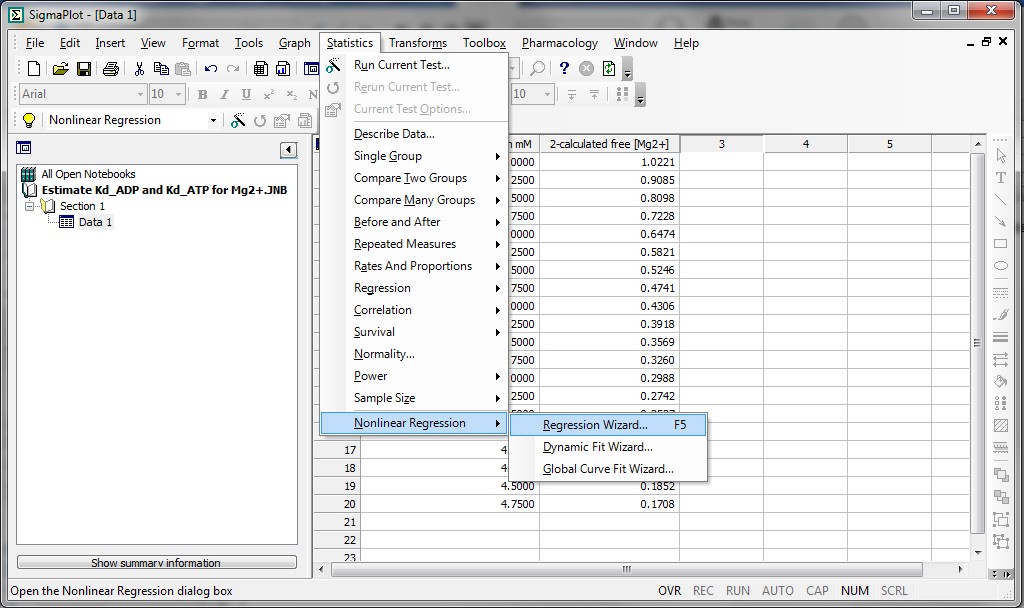
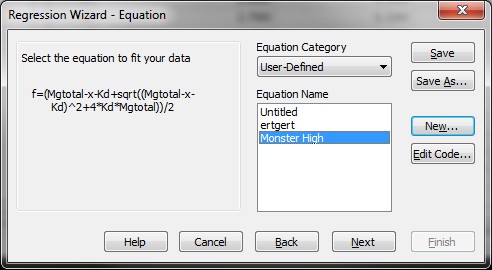
Substep III) Next, click on New…

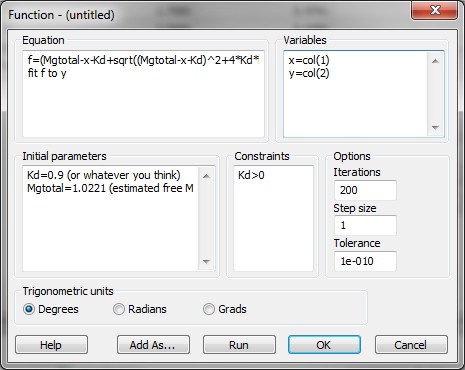
Substep IV) Next, type the following information into the appropriate dialog windows:
Equation:
f=(Mgtotal-x-Kd+sqrt((Mgtotal-x-Kd)^2+4*Kd*Mgtotal))/2
fit f to y
Initial parameters:
Kd=0.9 (or whatever you think is a good guess for Kd_ADP)
Mgtotal=1.0221 (estimated free Mg2+ before addition of first bolus of ADP or ATP)
Variables:
x=col(1)
y=col(2)
Constraints:
Kd>0
Options
Iterations:
200
Step size
1
Tolerance:
1e-010

Kd = 9.143e-1 StdErr 2.818e-2, which is equivalent to Kd=0.9143 mM +/- 0.02818 mM (SEM).
9. Conversion of free Mg2+ to ATP
In order to measure ANT activity using the present methodology, one needs to add ADP to mitochondria (isolated, or in situ from permeabilized cells, or in homogenates), and record changes in MgG fluorescence. A typical experiment would look like this:

As you can see in the above graph, addition of ADP to the suspension leads to an immediate decrease in MgG fluorescence, followed by a more gradual decrease. The initial immediate decrease in MgG fluorescence is due to chelation of extramitochondrial free Mg2+ by the ADP, and the following, more gradual decrease is due to the stronger chelation of extramitochondrial free Mg2+ by the ATP exiting the mitochondria, while less and less ADP is available extramitochondrially to chelate Mg2+. Because the exchange of ADP for ATP by the ANT is a strict 1:1 stoichiometry, the rate of ATP appearing in the medium is equal to the rate of ADP-ATP exchange mediated by the ANT, thus, the ANT activity.
So, first you need to calibrate MgG raw fluorescence to [Mg2+]. To do that, you can use this excel: CORRECTION OF Mg AND CONVERSION TO ATP-PP.xlsx – please ask Christos Chinopoulos for the file. Shown below:
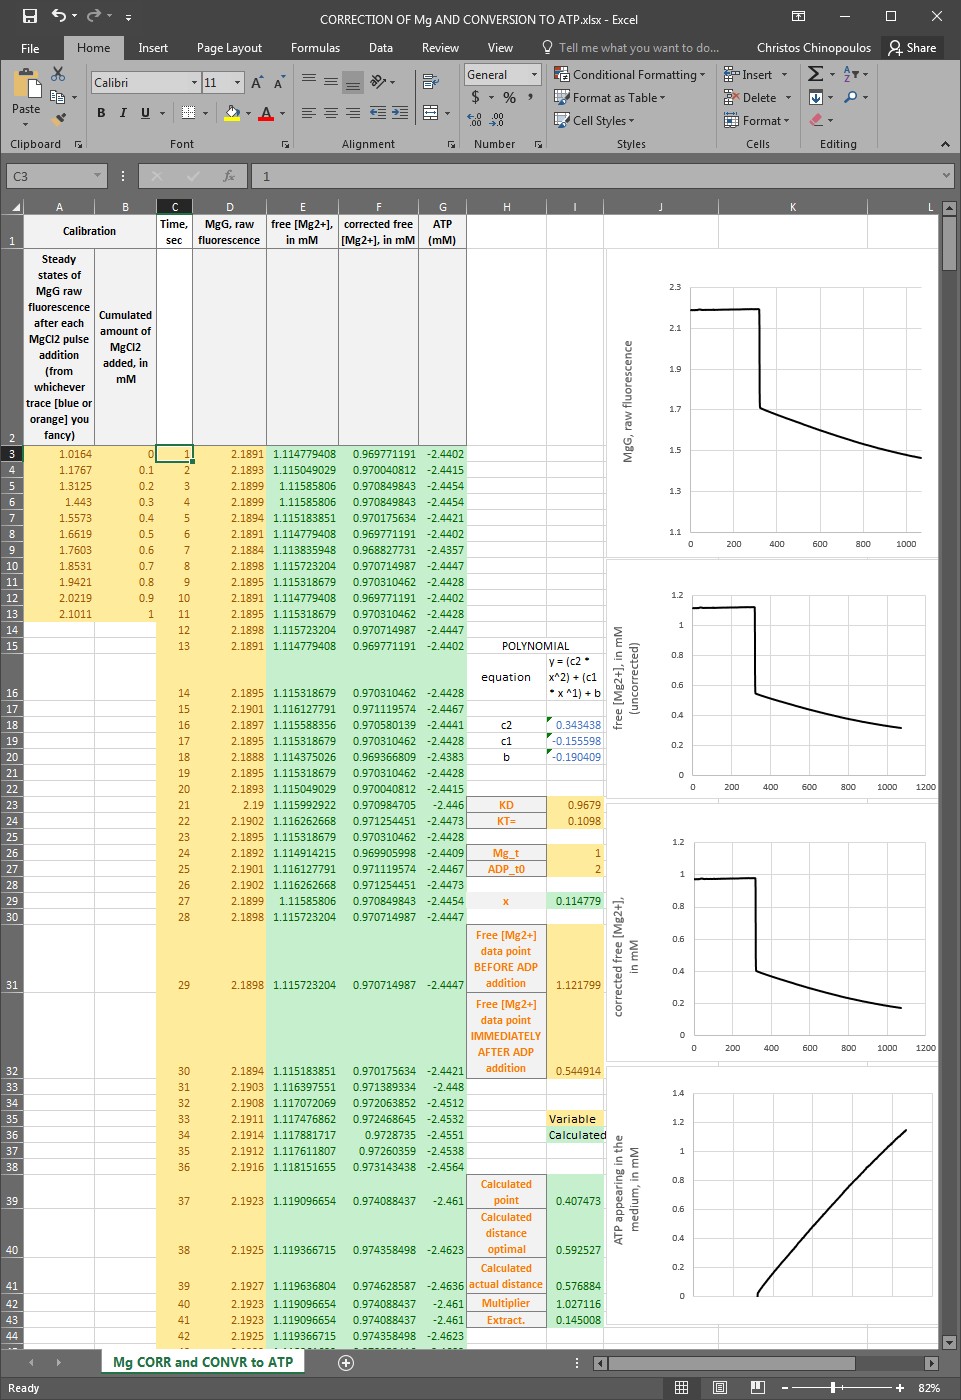
Instructions for using ‘CORRECTION OF Mg AND CONVERSION TO ATP.xlsx’ – please ask Christos Chinopoulos for the file
Note: you can only input data (variables) in yellow-colored boxes.
Note: Calculated data appear in green-colored boxes.
The excel sheet is populated with typical data; please replace them with your own.
First: In column C, input the time scale of your MgG trace (in seconds).
Second: In column D, input the MgG raw fluorescence data of the actual experiment where you added ADP and you wish to measure ANT activity.
Third: In column B, input the cumulated amount of MgCl2 added, in mM of the experiment performed as shown in blue or orange trace of step 5 in Kds determination of ADP, ATP for Mg2+.
Fourth: In column A, input the steady states of MgG raw fluorescence obtained right after each MgCl2 pulse addition, obtained from either blue or orange trace of step 5 in Kds determination of ADP, ATP for Mg2+.
Fifth: In box I23, input the value of Kd_ADP (in mM), which you determined in step 6 (substeps I-VIII) in Kds determination of ADP, ATP for Mg2+.
Sixth: In box I24, input the value of Kd_ATP (in mM), which you determined in step 6 (substeps I-VIII) in Kds determination of ADP, ATP for Mg2+.
Seventh: In box I26, input the amount of total MgCl2 in your buffer (in mM).
Eighth: In box I27, input the amount of ADP you added (in mM).
Ninth: In box I31, input the concentration of free [Mg2+] calibrated from MgG fluorescence, JUST BEFORE THE ADDITION OF ADP.
Tenth: In box I32, input the concentration of free [Mg2+] calibrated from MgG fluorescence, JUST AFTER THE ADDITION OF ADP.
If you have done the above correctly, columns E, F and G will be populated with the calibrated but uncorrected MgG fluorescence to free [Mg2+], the corrected free [Mg2+] in mM, and converted free [Mg2+] to [ATP], respectively. Note that data on [ATP] appearing in the medium prior to addition of ADP will be negative, and this is normal: the method does not make sense if there is no ADP added to the medium. The ‘correction step’ is necessary because of the slight unreliability of MgG stemming from the fact that it is a single excitation/single emission fluorescent dye. Furthermore, these data will also be depicted in the corresponding graphs to the right. By performing a linear regression of the [ATP] appearing in the medium, you can determine the rate of ANT activity.
POSSIBILITY FOR METHOD VERIFICATION: Add 1 or 2 micromolar of carboxyatractyloside (not more, otherwise you may induce permeability transition), a couple of minutes after addition of ADP to the mitochondria; this should stop the further increase in the rate of ATP appearing in the medium. If it does stop, it means that all of the ADP-ATP exchange was due to the ANT. If there is a residual rate of [ATP] appearing in the medium, it means that there are competing ADP-phosphorylating reaction(s). If you see strong downward drifts of [ATP] upon conversion of the entire amount of ADP to ATP, this indicates ATP hydrolysis; this proceeds even during the mitochondrial ATP formation step, thus your ANT activities rates are underestimated.
10. Dependence of ANT activity to Mg2+
As you may have guessed, the rate of ADP-ATP exchange mediated by the ANT depends on Mg2+ concentration. For those who did not figure this out yet, here is a simple explanation: The ANT transports the free forms of ADP and ATP, unbound to Mg2+ (unlike the F0-F1 ATP synthase that uses the Mg-bound ADP and ATP forms). Thus, if there is Mg2+ in the medium, it will ‘compete’ with the ANT for ADP or ATP. The more Mg2+ there is in the medium, the stronger the competition. Some people have experienced this from a different experimental setting: when one measures mitochondrial membrane potential (i.e. with safranin O) and ADP is added, there is a small depolarization. Depending on the amount of the ADP added, when it will be all converted to ATP, there will be a repolarization almost to baseline values. If this experiment is done in the presence or absence of Mg2+, it is obvious that in the absence of Mg2+, the ADP-induced repolarization comes faster. This is because in the presence of Mg2+, the ANT is exchanging adenine nucleotides at a slower rate. This phenomenon can be seen below: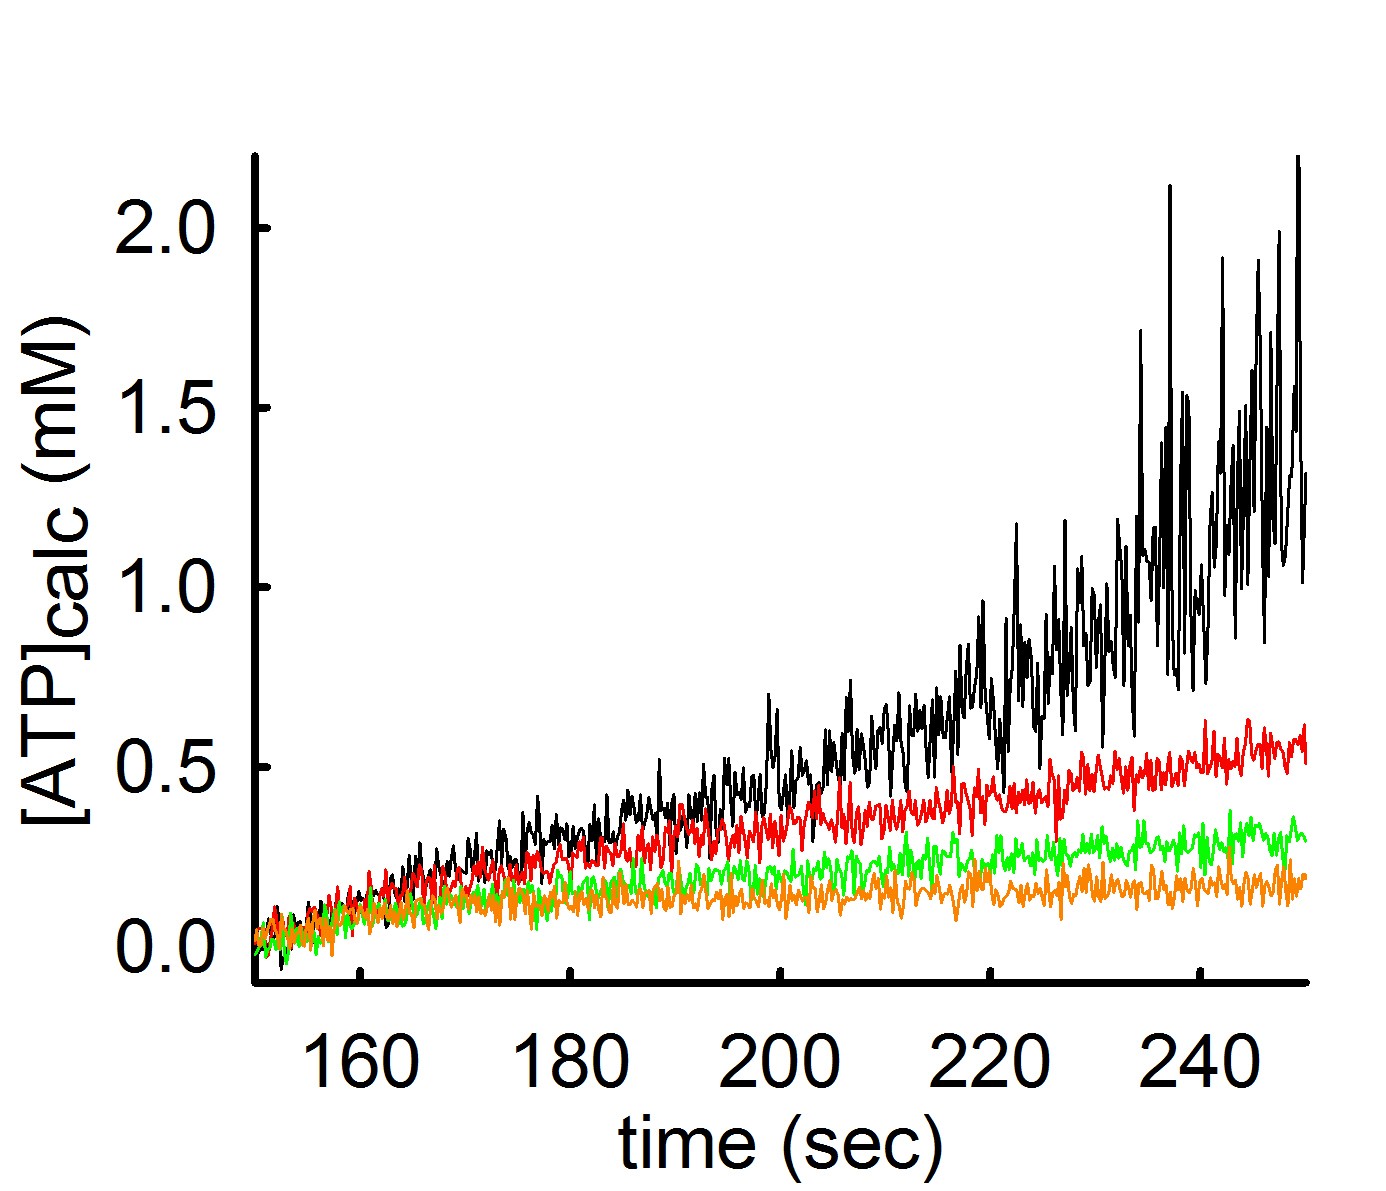
In the experiment shown above, ATP appearing in the medium is measured using the exact same mitochondria and conditions, but variating the concentration of Mg2+ in the buffer. By increasing the amount of Mg2+ by 0.25 mM at a time (black 0.25 mM MgCl2 -> red 0.5 mM MgCl2 -> green 0.75 mM MgCl2 -> orange trace 1 mM MgCl2) the rate of ATP appearing in the medium decreases.
By the same token, the same phenomenon occurs if one variates the amount of ADP added in the medium, but keeping the concentration of total Mg2+ constant. This can be seen below: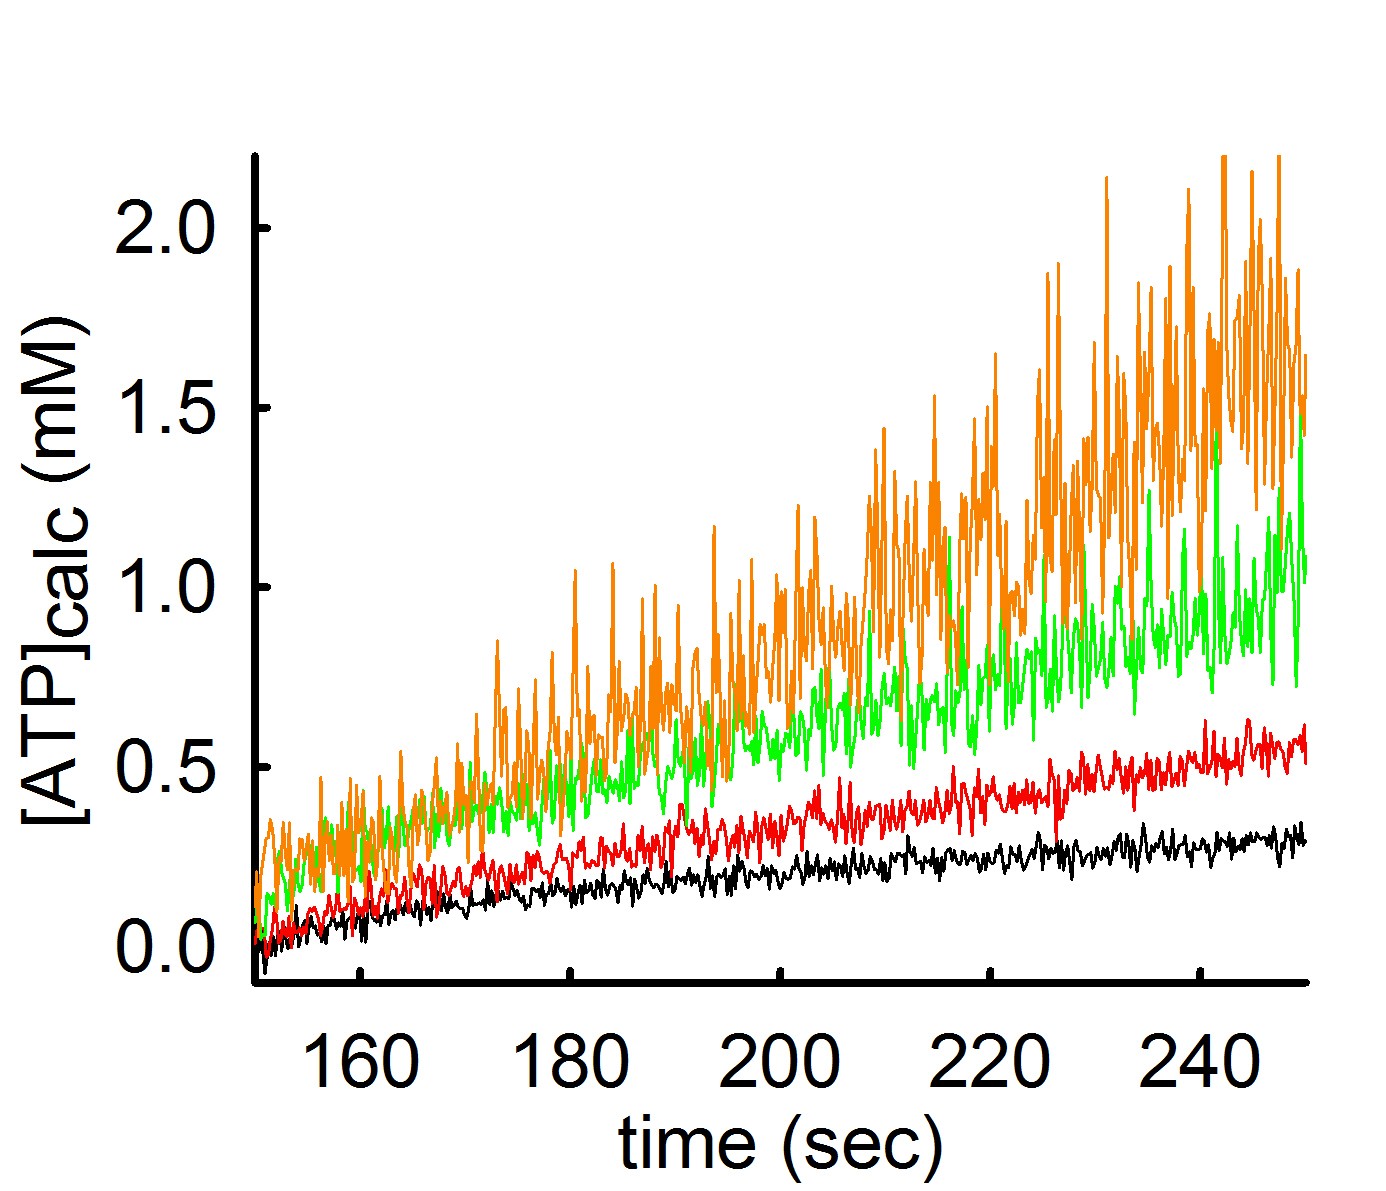
In the experiment shown above, ATP appearing in the medium is estimated using the exact same mitochondria and conditions, but variating the concentration of ADP added to the buffer. By decreasing the amount of ADP by 0.5 mM at a time (black 2 mM ADP -> red 1.5 mM ADP-> green 1.0 mM ADP-> orange trace 0.5 mM ADP) the rate of ATP appearing in the medium increases. However, the ‘price’ that one has to pay when using low amounts of Mg2+ or high amounts of ADP in order to obtain a high ADP-ATP exchange rate, is a decreased signal-to-noise ratio (hairy traces).
The above effect of Mg2+ on the ADP-ATP exchange rate (thus, the ANT activity) has been originally reported by Klingenberg and Pfaff, in Regulation of Metabolic Processes in Mitochondria, (edited by JM Tager, S Papa, E Quagliariello and EC Slatter). BBA Library, Vol 7. Elsevier, 1966, page 180). This is a book (but who reads books, right?). This phenomenon has been also mentioned in European J Biochem (now FEBS Journal), 1968, vol 6, pages 66-79, by Pfaff and Klingenberg.
11. Dependence of ANT activity on DΨm
ANT activity depends on many parameters, to an unequal extent. The most important parameter is the mitochondrial membrane potential, ΔΨm, see The ADP-ATP Translocation in mitochondria, a membrane potential controlled transport. Because of this, ANT activity should ALWAYS be measured together with ΔΨm. What can be even more informative, is the determination of ANT activity within a range of ΔΨm values. That can be achieved by ‘clamping’ ΔΨm with small amounts of an uncoupler, and measure in parallel ANT activity and ΔΨm. These data can be later combined, and presented as ‘exchange rate activity as a function of voltage’, just like a typical I/V curve of a channel or a transporter. Such an example is given below (adapted from here):
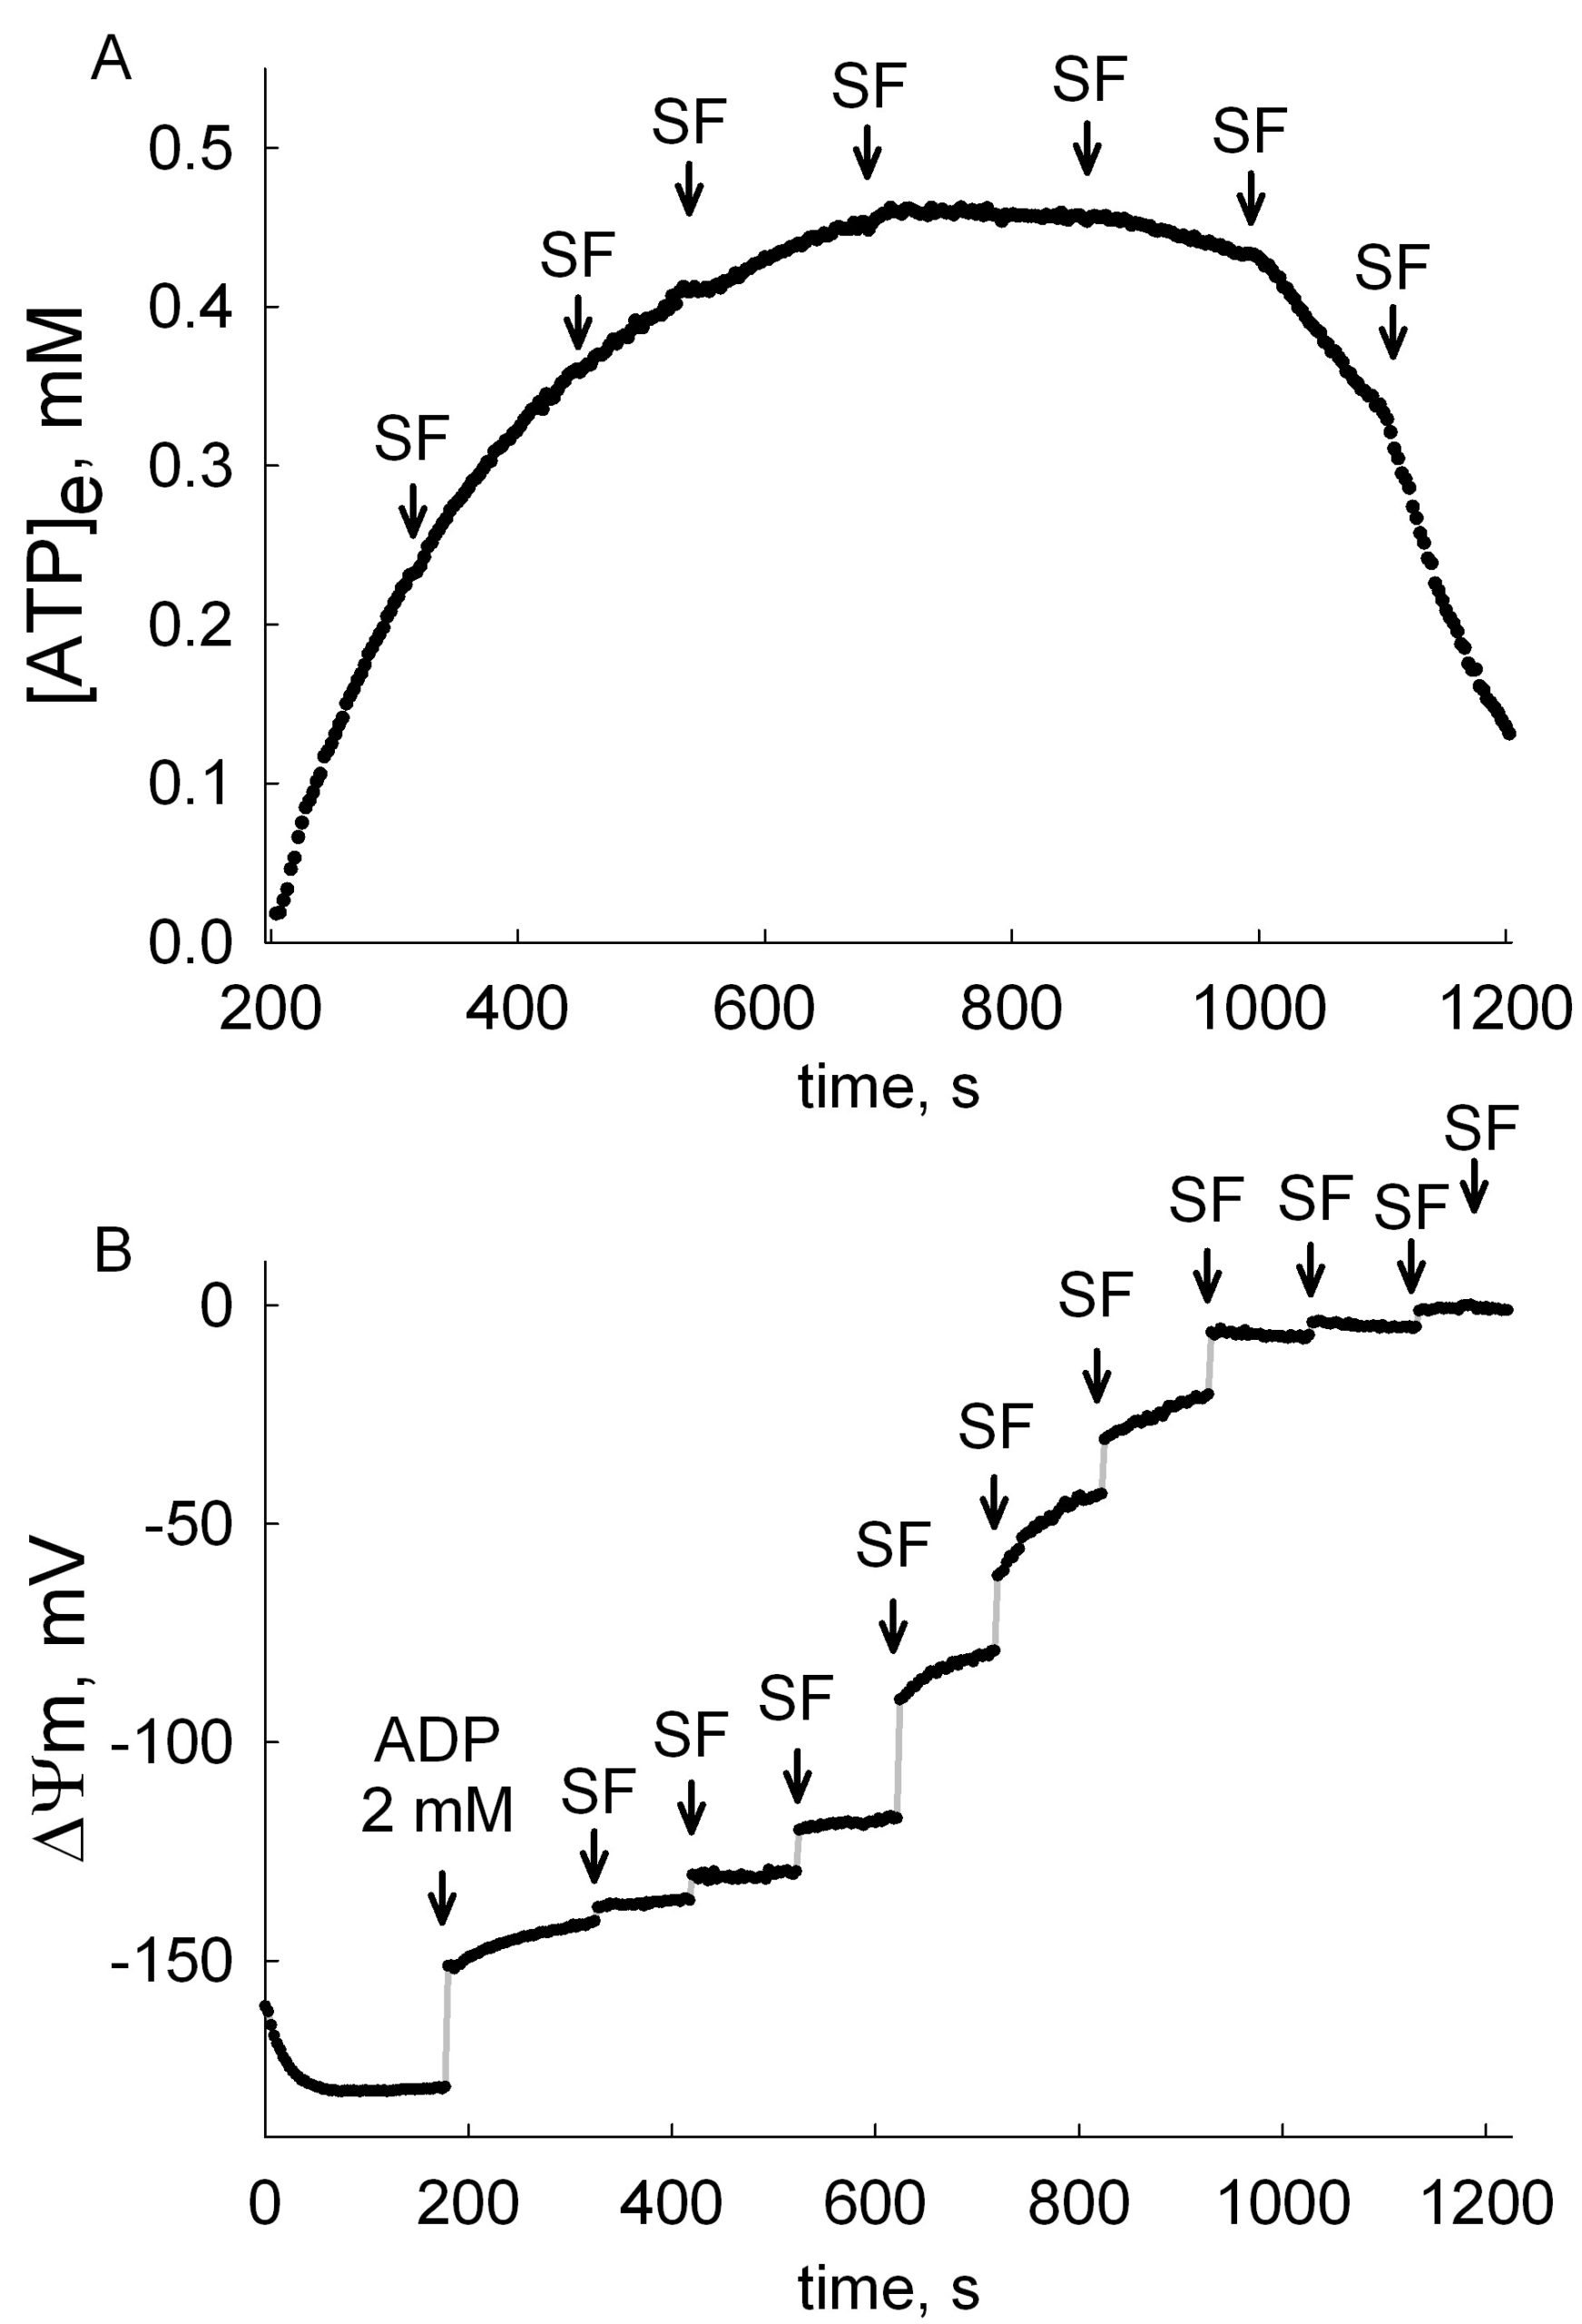
In the figures above, the estimation of ADP-ATP exchange rates and ΔΨm are shown, in permeabilized cells. A: Time course of [ATP]e in the medium, calculated from [Mg2+]free. Effect of membrane depolarization to various voltages by stepwise addition of 10 nM SF 6847. B: Reconstructed time course of ΔΨm, calculated from safranin O fluorescence. Permeabilized cells were challenged initially by 2 mM ADP, followed by stepwise additions of 10 nM SF 6847. By combining the data obtained from these two experiments, the correlation of ADP-ATP exchange rate as a function of ΔΨm can be depicted:

Note how steeply dependent is the ADP-ATP exchange rate to ΔΨm in the interval -145 mV – -130 mV. The choice of substrates, quality of mitochondria, buffer composition, to name a few, will all affect ΔΨm, and as extension of this, ADP-ATP exchange rate. ALWAYS measure ADP-ATP exchange rate as a function of ΔΨm.
Also, from such experiments, the membrane potential value at which there is no net flux of ADP nor ATP across the inner mitochondrial membrane through the ANT, termed the reversal potential of the ANT (Erev_ANT), can be determined. See more about Erev_ANT.
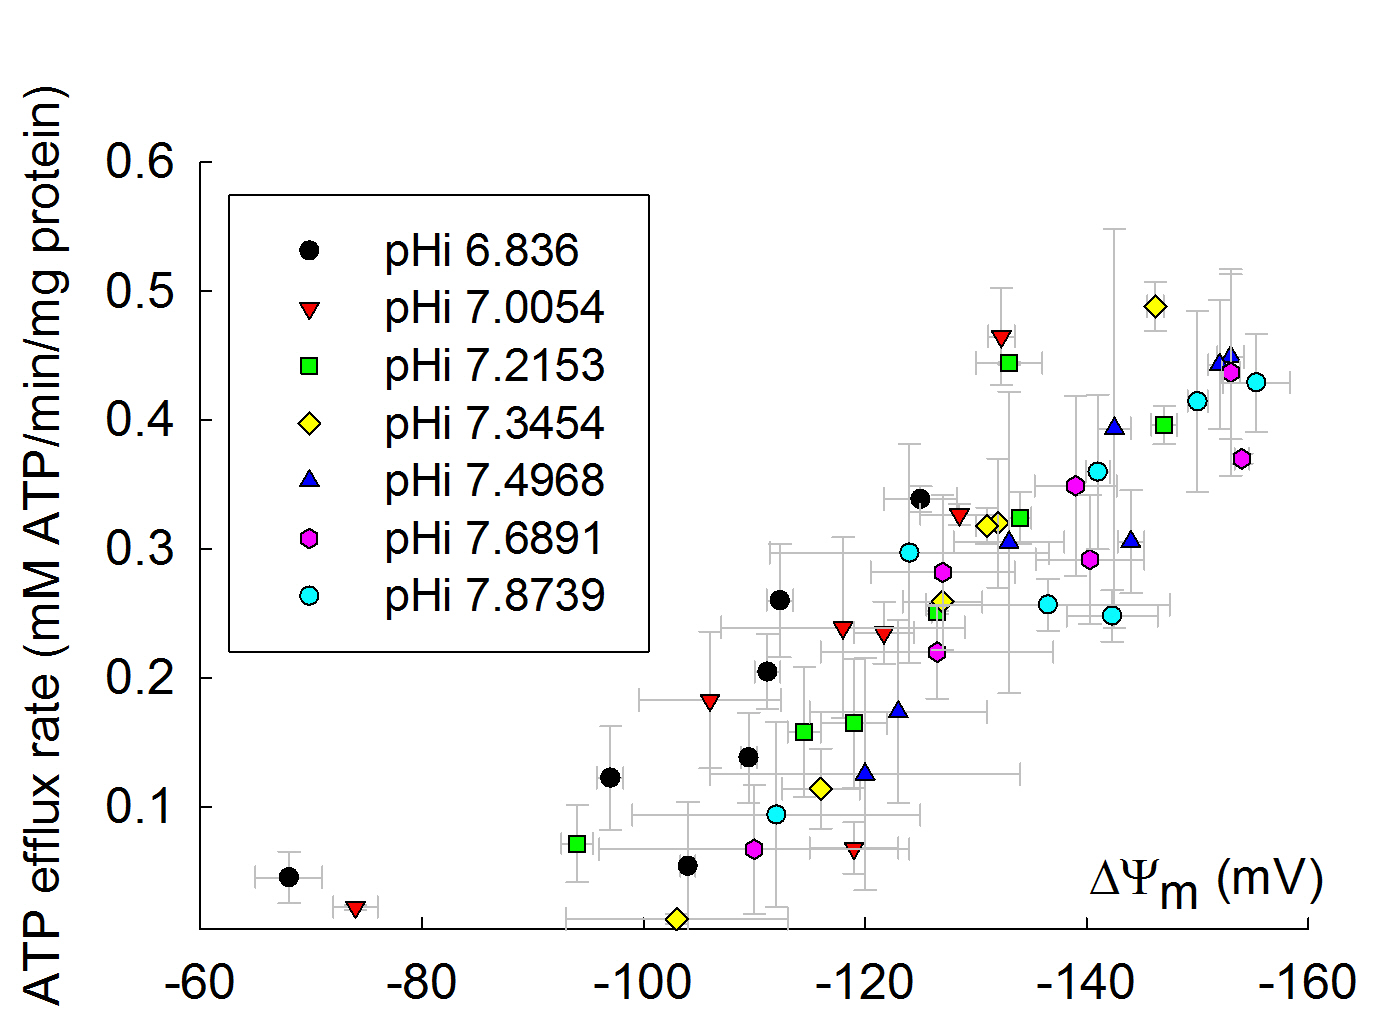
12. Dependence of ANT activity on pH
The dependence of ANT activity on pH is rather small, but significant. Below you can see the dependence of ADP-ATP exchange rate as a function of pH, as a function of ΔΨm, adapted from Biophys J. 2009 Mar 18;96(6):2490-504:
13. Influence of other parameters on ANT activity
Besides, Mg2+, ΔΨm, and pH, ANT activity depends on other parameters, but to a lesse degree. Most of them are summarized in the table appearing below, which is adapted from “Modeling of ATP-ADP steady-state exchange rate mediated by the adenine nucleotide translocase in isolated mitochondria”, published in FEBS J. 2009 Dec;276(23):6942-55.
14. Limitations of the method
As with any other method, the present one has its own limitations. These are:
Limitation #1: Estimation of ADP-ATP exchange rate using MgG fluorescence cannot be used in the presence of a high concentration of Ca2+ in the medium; MgG is sensitive to Ca2+, see ‘Why Magnesium Green?‘.
Limitation #2: Estimation of ADP-ATP exchange rate using MgG fluorescence cannot be used simultaneously with other fluorophores with spectral overlap to that of MgG.
Limitation #3: Estimation of ADP-ATP exchange rate using MgG fluorescence cannot be used if your mitochondria exhibit a relatively high Mg2+ transport activity (rare property of Arabidopsis and yeast mitochondria). Of course all types of mitochondria exhibit Mg2+ transport mechanisms, but unlike those reported in Arabidopsis and some yeasts, Mg2+ flux is negligible).
Limitation #4: Nor FCCP neither CCCP can be used while estimating ADP-ATP exchange rate using MgG fluorescence; these compounds quench MgG fluorescence (or any other fluorophore based on the fluorescein structure, such as Calcium Green). you can use SF6847, also known as Tyrphostin 9 or Malonaben (see: The interaction of highly active uncouplers with mitochondria by Terada H, 1981, Biochim. Biophys. Acta. 639:225–242). SF6847 can be purchased from here:
http://www.enzolifesciences.com/BML-EI215/tyrphostin-9/
50 mg costs 62 EUR, 177.0538 milliliters for 1 mM stock, enough for 354,106 experiments (0.5 microM or less is needed for complete collapse of mitochondrial membrane potential).
15. 'Under the hood' advices
Under the hood advice #1: Regarding the buffer that you will use to measure ADP-ATP exchange rate (‘ANT buffer‘), use only 20-30 mM [Cl–] salts, the remaining anion can be gluconate. ~20 mM [Cl–] is within the physiological range of intracellular [Cl–] for all tissues. ANT is inhibited at high [Cl–]; 140 mM [Cl–] inhibits ANT activity by ~35%, while with 140 mM gluconate inhibition is only ~7% (Gropp et al., 1999). Furthermore, mitochondria exhibit similar respiration rates and membrane potential but significantly lower steady-state rates of ROS formation in 20 mM [Cl–], as compared to mitochondria exposed to 140 mM [Cl–].
Under the hood advice #2: Use minimum 5 mM, preferably 10 mM [Pi] in your buffer, for the following reasons: There are two Pi carrier isoforms in mitochondria with Km values for Pi (on the external membrane surface) of 2.2 and 0.78 mM, respectively (Palmieri, 2004). The high concentration of phosphate (10 mM) achieves 81.97 % and 92.76 % saturation of the low and high-affinity Pi carrier, respectively. At lower concentrations extramitochondrial Pi becomes rate-limiting for oxidative phosphorylation (Tager et al., 1983), while at saturating [Pi] the rate of Pi transport greatly exceeds the net rate of ATP synthesis (Ligeti et al., 1985). At [Pi] ≤ 3 mM ATP formation is largely dependent on the F0-F1-ATP synthase. Finally, Pi has been shown by mathematical modeling to play a significant role in stimulating both oxidative phosphorylation and tricarboxylic acid cycle (Wu et al., 2007), as originally proposed by Bose (Bose et al., 2003). 10 mM KH2PO4 does not affect free [Mg2+] measured by MgG. This is partly because at pH=7.25, KH2PO4 dissociates to H2PO4– and HPO42- (pK2=7.21) and neither of these ions form a precipitation with Mg2+ (PO43- is the only component that forms Mg3(PO4)2 precipitate, but this ion is essentially not present at this pH (pK3=12)). On the other hand, Mg2+ also forms soluble coordination compounds with phosphate anions (preferably with HPO42-). However, chelation of Mg2+ by HPO42- in the low millimolar range is negligible, since the dissociation constant for the [Mg2+-HPO42-] complex is 210 mM (Dawson et al., 1986), although a much lower value has been reported elsewhere (Wu et al., 2007).
Under the hood advice #3: Include BSA in your buffer. It foams, so don’t shake. The importance of including bovine serum albumin in the assay medium is two-fold: firstly, albumin binds both fatty acids and their coenzyme A esters, that can inhibit ANT activity (Wojtczak and Zaluska, 1967), (Morel et al., 1974); secondly, fatty acids exhibit uncoupling properties plus inhibitory effects on respiratory chain components (Wojtczak and Schonfeld, 1993) that decrease pmf, particularly with succinate as a substrate (Tretter et al., 2007).
Under the hood advice #4: Don’t use less than 1 mM Mg2+ in your buffers if you investigate isolated mitochondria, and 1.5 mM Mg2+ if you investigate permeabilized cells. The use of 1 mM total [Mg2+] yields 0.32-0.6 mM free [Mg2+] (depending on the type and amount of adenine nucleotide present in the extramitochondrial medium), which is within the physiological range of cytosolic free [Mg2+] (Rodriguez-Zavala and Moreno-Sanchez, 1998), (Rutter et al., 1990), (Jung et al., 1997).
Under the hood advice #5: Don’t add less than 1 mM ADP to initiate ADP-ATP exchange (best combination: 2 mM ADP and 1 mM MgCl2 for isolated mitochondria, and 2 mM ADP and 1.5 mM mM MgCl2 for permeabilized cells).
Under the hood advice #6: Include Ap5A (25-50 microM) in your buffer.
Under the hood advice #7: ATP and ADP stocks: i) use of highest purity available; ii) titrate to pH = 6.2 – 6.9 (with KOH or NaOH), do NOT titrate to pH 7.04-7.4; iii) NEVER use Mg2+ salts!!!; iv) keep in aliquots.
Under the hood advice #8: Estimate how many experiments you will perform, and prepare the required amount of buffer prior to the experiments; add to it 1.1 mM MgG, and keep it at 37 0C (or the temperature of your choice). This will eliminate the potential differences in MgG concentration from one experiment to another, plus minimize signal drifts.
16. 'Over the hood' advices
Over the hood advice: Measure ADP-ATP exchange rate always in parallel with measurements of DYm. I know I mentioned that before, I just want to make this point absolutely clear.
17. More tricks: determination of ATP consumption rate and ATP/ADP ratio
Since with this methodology one can measure the ATP efflux from mitochondria mediated by the ANT, it can also be applied for measuring ATP consumption by sufficiently depolarized mitochondria. Furthermore, since the total amount of [ADP]+[ATP] remains constant in the extramitochondrial medium, the extramitochondrial ATP/ADP ratio can also be calculated. An example of this is shown in the figures below:
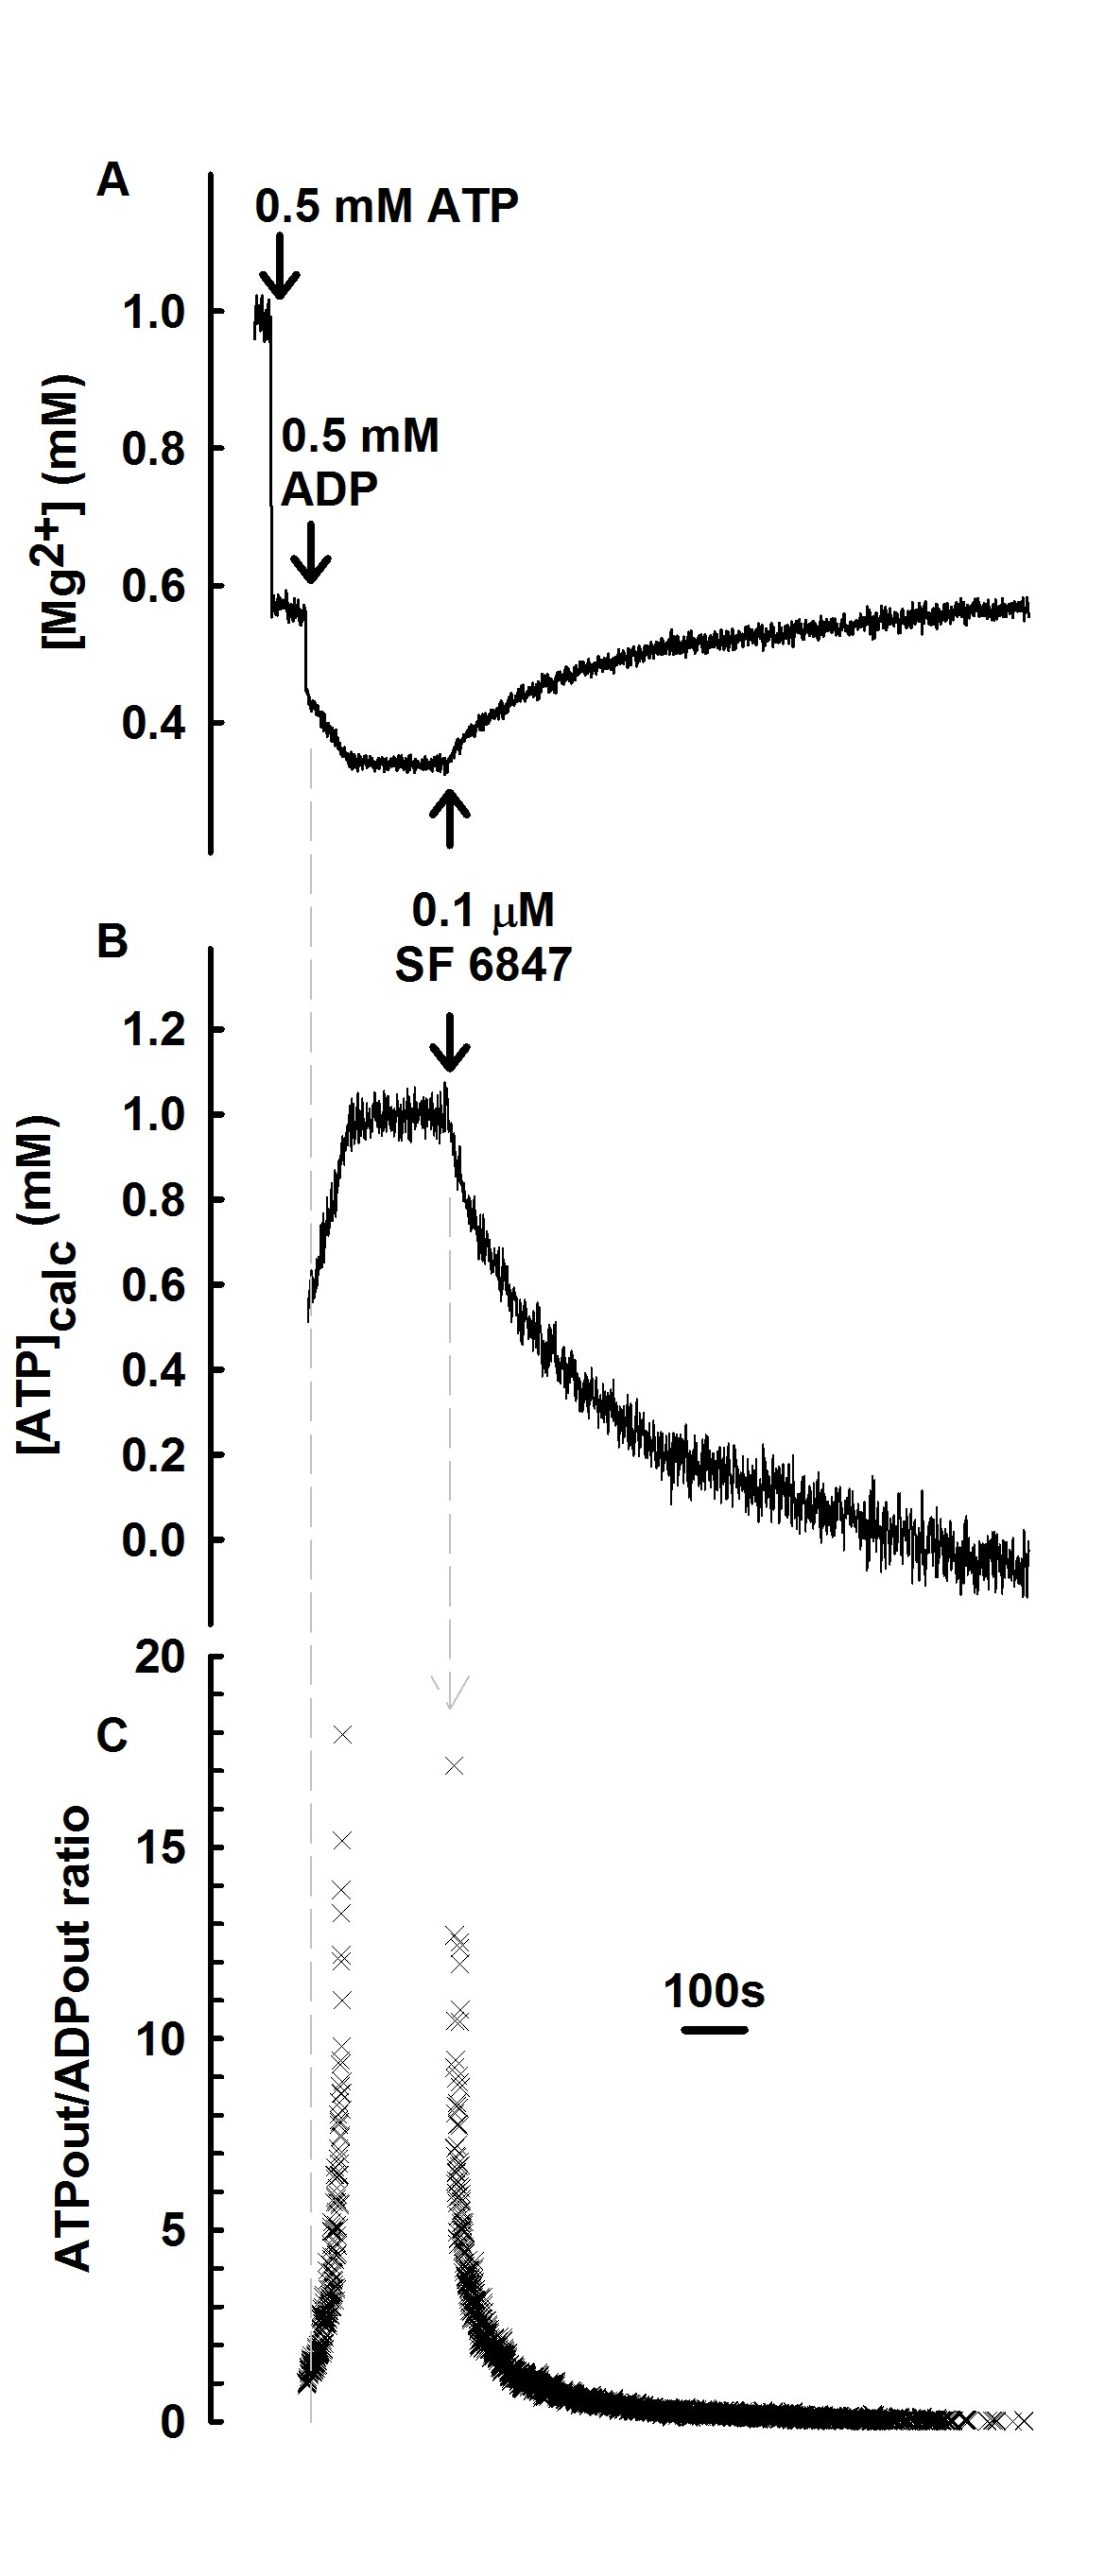
In the panels above, the reversibility of the ANT and estimation of extramitochondrial ATP/ADP ratio is depicted. These are reconstructed time courses of free [Mg2+], calculated from MgG fluorescence in liver mitochondria. 0.5 mM ATP and 0.5 mM ADP were added where indicated. After consumption of ADP, there is no further alteration in free [Mg2+]. Upon addition of 0.1 mM SF 6847 a progressive elevation in free [Mg2+] is observed reflecting a decrease in extramitochondrial ATP and concurrent increase in ADP. This reaction process continues until ATP is consumed. B: Time course of [ATP]t in the medium, calculated from the data in panel A. C: Time course of [ATP]t/[ADP]t in the medium, calculated from the data in panel B. Panels A, B and C are aligned on the x-axis (time, sec). Adapted from Biophys J. 2009 Mar 18;96(6):2490-504.
18. Erev_ANT, Erev_ATPase
Although the present methodology concerns the measurement of ADP-ATP exchange rate mediated by the ANT (i.e. the ANT activity), mindful that the ANT is a reversible transporter, I outline a few details regarding its directionality.
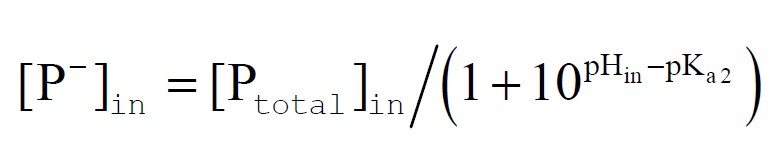
To put it in the most naive way, the ANT can transport ADP inside and ATP outside the mitochondria (forward mode), or ADP outside and ATP inside the mitochondria (reverse mode). The membrane potential value at which there is no net transfer of adenine nucleotides is called the reversal potential of the ANT, designated as Erev_ANT. Erev_ANT depends exclusively on the concentration of the ANT reactants, i.e. ADP and ATP across the inner mitochondrial membrane. By thermodynamic deduction, Erev_ANT is equal to:

where “in” and “out” signify inside and outside the mitochondrial matrix, respectively, R is the universal gas constant 8.31 J*mol-1*K-1, F is the Faraday constant 9.64*104 C·mol-1, and T is temperature (in Kelvin).
PLEASE DO NOT CONFUSE ANT ACTIVITY WITH ANT DIRECTIONALITY.
Just like Erev_ANT, F0-F1 ATP synthase has its own reversal potential, designated as Erev_ATPase. By thermodynamic deduction, Erev_ATPase is equal to:

and
19. Erev estimator
‘Erev_estimator’ is a software for PC (no Mac version, sorry Clair), with which the user can change the value of any parameter affecting Erev_ANT and/or Erev_ATPase, and observe how are the A (green), B (orange), C (grey) and D (brown) spaces altered. Below you can see a screenshot of the software.

20. Erev modeler
‘Erev_modeler’ is a software for PC (no Mac version, sorry), with which the user can change the value of any parameter affecting Erev_ANT and/or Erev_ATPase, and observe how are the A (green), B (orange), C (grey) and D (brown) spaces altered. The difference from Erev_estimator is that the user can choose among many parameters as y-axis. Below you can see a screenshot of the software.
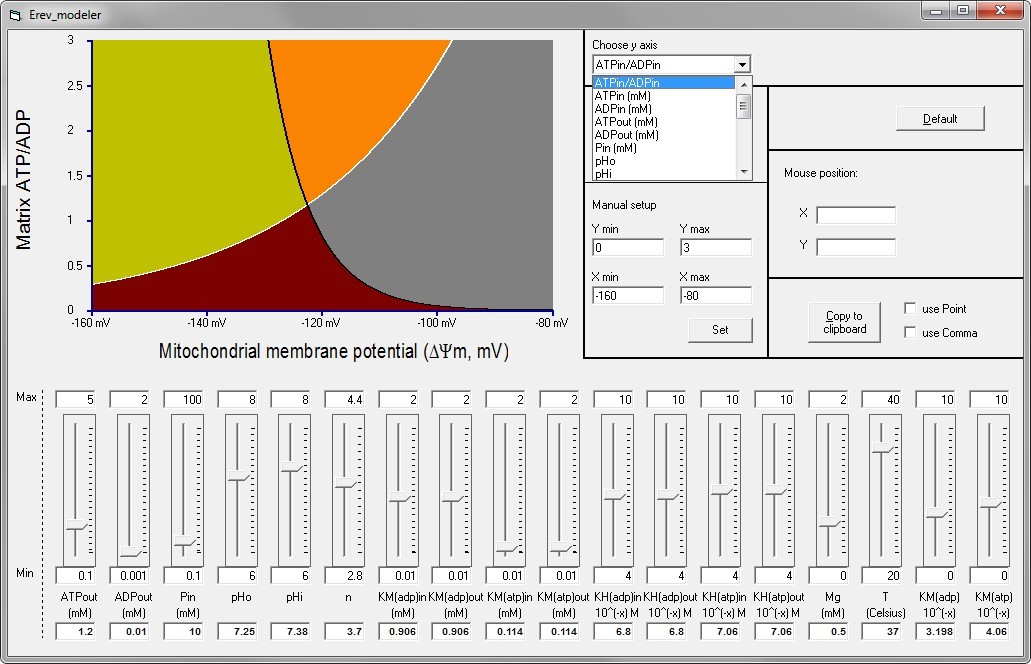
‘Erev_modeler’ can be obtained from Christos Chinopoulos, as an exe file (Chrome browser may warn you that ‘Erev_modeler is not commonly downloaded and may be dangerous‘, and prompt you to discard the file; click on the arrow and choose “Keep”). Other browsers will also warn you, just do what it takes to keep the file.
Instructions for using Erev_modeler are identical to those for Erev_estimator: INSTRUCTIONS FOR USING Erev_estimator. The only difference is that you can choose a different parameter for y-axis.
21. What can you do with this method?
So far, it should be obvious that with this methodology one may do the following:
i) determine ATP efflux rate from energized, isolated or in situ mitochondria of permeabilized cells (or homogenates)
ii) determine ATP influx rate of sufficiently depolarized isolated or in situ mitochondria of permeabilized cells (or homogenates)
iii) determine the extramitochondrial ATP/ADP ratio.
Please keep in mind, that with this method -if performed correctly- you will obtain meaningful results, but by themselves they will not be so informative; this is because ADP-ATP exchange rate is strongly dependent on ΔΨm. Thus, ADP-ATP exchange rate determination should ALWAYS be performed in parallel to measurements of ΔΨm. Bearing that in mind, the true power of this method appears, which is the determination of ADP-ATP exchange rate as a function of ΔΨm over a range of ΔΨm values. This has been demostrated in Hum Mol Genet. 2011 Aug 1;20(15):2964-74, showing that adPEO mutations in ANT1 impair ADP–ATP translocation in muscle mitochondria. More specifically, it was shown that mutant human ANT1 caused dominant mitochondrial defects characterized by decreased ADP–ATP exchange function and abnormal translocator reversal potential, see figure below.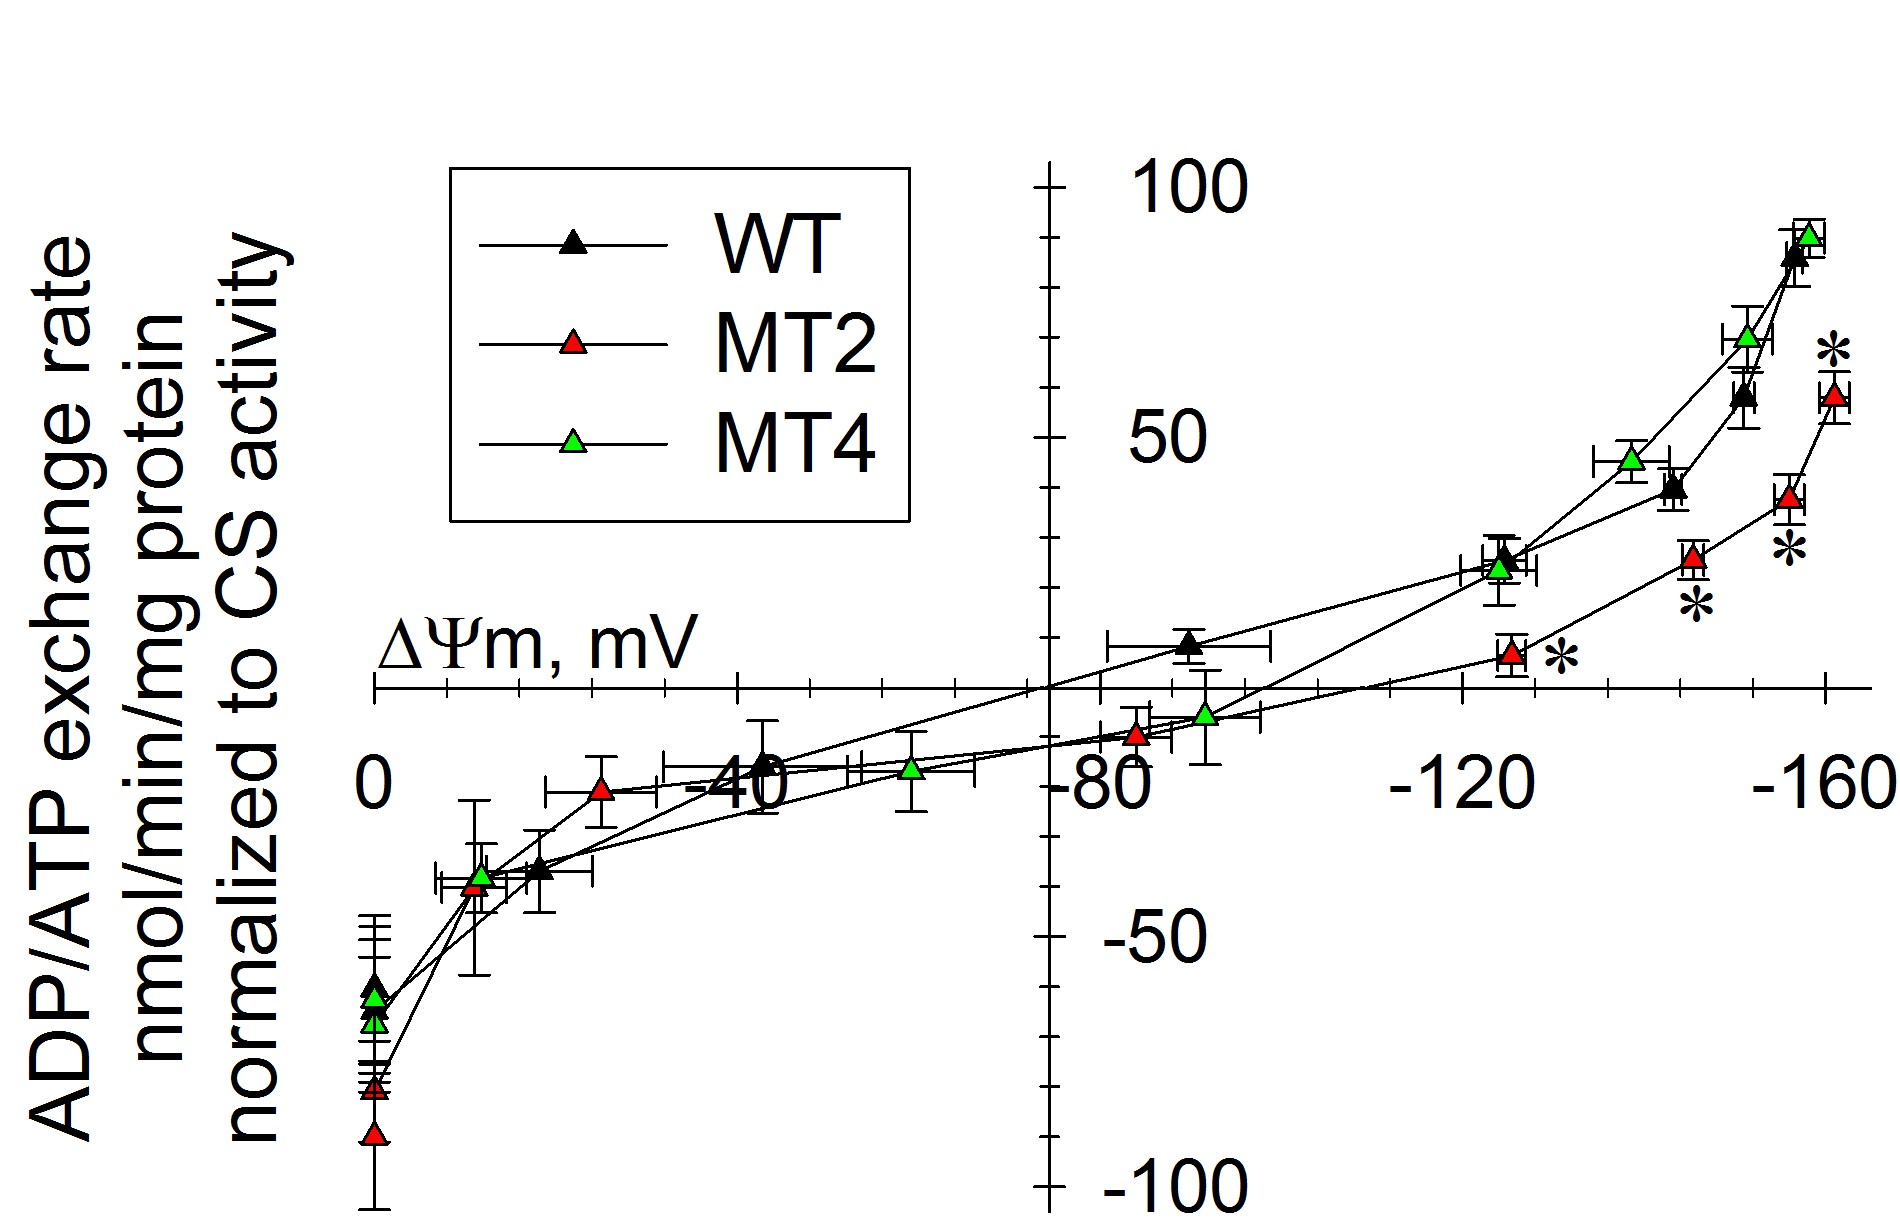
Legend for figure shown above: ADP–ATP exchange rate/ΔΨm profile of C2C12 myotubes expressing WT and mutant ANT1. Plot of ADP–ATP exchange rate mediated by ANT versus ΔΨm in in situ mitochondria of WT, A114P and V289M C2C12 permeabilized cells depolarized to various voltages by increasing amounts of SF 6847, and normalized to specific citrate synthase activity. Each point in the graph represents the average ADP–ATP exchange rate calculated by linear regression of the MgG fluorescence, calibrated and converted to ATP appearing in the medium, as a function of calibrated safranine O values. Each point is the average of five to seven independent experiments. *: Statistically significant by one-way ANOVA followed by Tukey’s post-hoc test versus WT, P = 2.0e−3 (ADP), 4.0e−3 (10 sf), 0.043 (20 sf) and 0.045 (30 sf).
Furthermore, with this methodology one can determine the effective P/O ratio. For a description of such a protocol, click Instructions for calculating P per O ratio. That protocol describes the steps needed to extract and process the raw oxygen and fluorescence signals obtained from an O2k oxygraph equipped with an LED Module, as well as the steps required to complete the ‘Template P-O calculation.xlsx’ excel template file as elaborated in Salin et al. (2016). For any feedbacks or questions, please contact Dr. Karine Salin (salin.karine@gmail.com).
22. CREDITS
- Prof. László Csanády, for working out the standard binding equations
- Dr. Evgeny Metelkin and Dr. Oleg Demin for the ANT-related modeling
- Dr. Gergely Kacsó, for generating the excel sheets
- Dr. András Máthé for compiling the Erev_estimator and Erev_modeler
 Dr. Karine Salin for working out the methodology of determining the effective ATP/O ratio, and generating the Excel template for automatic data extraction and calculation