Brain Structure and Function, Volume 223, Issue 8, pp 3531–3542 (2018)
DOI: 10.1007/s00429-018-1703-4
Péter Przemyslaw Ujma1,2, Péter Halász1, Péter Simor3, Dániel Fabó1, Raffaele Ferri4
1 Institute of Clinical Neuroscience, “Juhász Pál” Epilepsy Centrum, Amerikai út 57, Budapest 1145, Hungary
2 Institute of Behavioural Sciences, Semmelweis University, Nagyvárad tér 4, Budapest 1089, Hungary
3 Institute of Psychology, ELTE, Eötvos Loránd University, Kazinczy utca 23-27, Budapest 1075, Hungary
4 Oasi Research Institute-IRCCS, Via Conte Ruggero 73, 91018 Troina, Italy
Abstract
Slow waves recorded with EEG in NREM sleep are indicative of the strength and spatial extent of synchronized firing in neuronal assemblies of the cerebral cortex. Slow waves often appear in the A1 part of the cyclic alternating patterns (CAP), which correlate with a number of behavioral and biological parameters, but their physiological significance is not adequately known. We automatically detected slow waves from the scalp recordings of 37 healthy patients, visually identified CAP A1 events and compared slow waves during CAP A1 with those during NCAP. For each slow wave, we computed the amplitude, slopes, frequency, synchronization (synchronization likelihood) between specific cortical areas, as well as the location of origin and scalp propagation of individual waves. CAP A1 slow waves were characterized by greater spatial extent and amplitude, steeper slopes and greater cortical synchronization, but a similar prominence in frontal areas and similar propagation patterns to other areas on the scalp. Our results indicate that CAP A1 represents a period of highly synchronous neuronal firing over large areas of the cortical mantle. This feature may contribute to the role CAP A1 plays in both normal synaptic homeostasis and in the generation of epileptiform phenomena in epileptic patients.
Keywords: Electroencephalography, NREM sleep, Slow wave, Cyclic alternating pattern, Synaptic homeostasis
Introduction
Slow waves (SWs) in NREM sleep are prominent electroencephalographic phenomena which are the hallmark of slow wave sleep (SWS), but also appear in more superficial sleep states (Iber et al. 2007; Menicucci et al. 2009). SWs are arguably one of the most studied features of the sleep EEG microstructure, and their origin and function is uniquely well understood.
SWs are ~ 1 Hz oscillations mainly generated by the cerebral cortex through a synchronization–desynchronization pattern of neuronal firing. The steep downstate of the SW reflects cortical silence, that is, the almost complete absence of firing neurons, while most higher-frequency oscillations co-occur with the subsequent upstate in which synchronized firing takes place (Amzica and Steriade 1995; Chauvette et al. 2010; Contreras and Steriade 1995a; Steriade et al. 1993). Despite evidence for thalamic regulation in vivo (Crunelli and Hughes 2010; David et al. 2013), SWs are thought to be predominantly cortical oscillations, as cortico-cortical connections are essential to maintain them (Amzica and Steriade 1995), they are present in the deafferented cortex (Timofeev et al. 2000; Timofeev and Steriade 1996) and they are most prominent in the superficial layers of the cortex in which cortico-cortical connections predominate (Csercsa et al. 2010). While often visible over a large portion of the scalp (or electrocorticographic electrode arrays), SWs are local features of the cortex which are generated in a particular cortical area (Nir et al. 2011) and gradually propagate to other regions (Botella-Soler et al. 2012; Massimini et al. 2004; Menicucci et al. 2009; Riedner et al. 2007). Also, while most SWs originate from frontal areas, their source can be localized in virtually any other area (Botella-Soler et al. 2012; Menicucci et al. 2009; Murphy et al. 2009; Nir et al. 2011), and they gradually become more local later in the night (Nir et al. 2011; Riedner et al. 2007; Vyazovskiy et al. 2007). Slow wave activity recorded from the scalp realistically approximates cortically recorded SWs, which in turn reflect fluctuating patterns in neural firing (Contreras and Steriade 1995a; Destexhe et al. 1999). The spatial extent of slow waves is greater for large-amplitude waves (Nir et al. 2011) and the scalp topography of slow waves reflects differences in their cortical sources (Murphy et al. 2009; Riedner et al. 2011). The characteristic, synchronized alternation of neuronal population firing and silence plays an important role in synaptic homeostasis (Tononi and Cirelli 2014) and local increases in slow waves were seen after intensive training in tasks involving only limited cortical areas (Esser et al. 2006; Huber et al. 2004, 2006), indicating that the homeostatic need for SW activity accumulates locally and explaining why many SWs are local phenomena.
SW-producing NREM sleep is by no means a monolithic phenomenon: at some times, SW activity is steady and continuous, while at other times, it is intermittent, rhythmic and can often be elicited by stimulation (Parrino et al. 2012b; Terzano et al. 1990). The pattern of intermittent arousals—and anti-arousals (Hirshkowitz 2002; Terzano et al. 2002)—in NREM sleep constitutes the cyclic alternating pattern (CAP). CAP consists of intermittent phases of either almost pure SW trains (CAP A1), a mixture of SWs and high-frequency activity (CAP A2) or almost pure high-frequency activity and arousal (CAP A3), separated by periods of lower amplitude EEG (CAP B) or extended periods of NREM sleep with no CAP A phases (NCAP) (Terzano et al. 2001). SWs present in CAP A1 are likely to be at least in part functionally different from ordinary SWs: while their presence is reduced as a function of age similarly to ordinary SW activity (Carrier et al. 2001; Parrino et al. 2012b), CAP A expression (the proportion or absolute frequency of different CAP A events) is a relatively specific marker of disability with a different pattern in different pathologies (Bruni et al. 2010b) and it correlates with cognitive performance (Aricò et al. 2010; Drago et al. 2011; Ferini-Strambi et al. 2004) which is not the case for SW activity in general (Geiger et al. 2011; Ujma et al. 2017). Similarly to ordinary SWs, CAP A1 is characterized by increased EEG spectral power in the delta range (Ferri et al. 2005a, b), and at least on average a frontal origin (Ferri et al. 2005b). However, compared to CAP B NREM sleep, CAP A1 is characterized by greater synchronization of the signals of topographically distant EEG derivations (Ferri et al. 2005c, 2006).
All these studies of the electrophysiological characteristics of CAP, however, dealt with the phenomenon at a relatively macroscopic level, and none included the analysis of specific graphoelements such as SWs. As the herein reviewed recent results indicate, the characteristics of SWs deliver important information about their cortical generators, which may be different in CAP A1 (Botella-Soler et al. 2012). Therefore, we set out to compare the fine morphology of SWs recorded in NCAP and CAP A1 on the scalp in order to infer how (and how differently) the cerebral cortex is involved in the generation of each.
Methods
Subjects
37 young, healthy subjects (21 females, mean age 24.4 years, SD 4.1 years, range 20–36 years) were recruited using convenience and snowball sampling. This was a multi-center study in a cooperation between the Oasi Institute for Research on Mental Retardation and Brain Aging (IRCCS, Troina, Italy) and the Budapest University of Technology and Economics (BUTE, Budapest, Hungary). 20 subjects were recruited by the BUTE and 17 by the IRCCS with comparable inclusion and data registration protocols and identical signal processing methodology and statistical analysis.
The participants were all right-handed healthy volunteers, had no history of neurological or psychiatric illnesses. They reported having no trouble with sleep. At the time of the evaluation none of the participants were taking any form of medication (except contraceptives), and none abused alcohol. All subjects were requested not to drink caffeinated or alcoholic beverages during the entire study and not to take naps.
All procedures were approved by the ethical committees of the respective research institutions in accordance with the Declaration of Helsinki and informed consent was obtained from all individual participants included in the study. BUTE subjects received financial compensation (6000 HUF, approximately 20 EUR) for their participation.
EEG recording
All subjects underwent two nights of polysomnography recording and data from the second night were used for further analysis.
Polysomnographic recordings were carried out in a sleep laboratory. Lights-out time was based on the individual habitual bed time; subjects were allowed to sleep until they spontaneously awoke in the morning (IRCCS) or woken up after 9 h of sleep unless they awoke spontaneously (BUTE). Polysomnographic recordings included an electrooculogram (EOG), electroencephalogram (19 channels: Fp1, Fp2, F3, F4, Fz, F7, F8, C3, C4, Cz, P3, P4, Pz, T3, T4, T5, T6, O1, O2; electrodes placed according to the 10–20 International System referred to mathematically linked earlobes (IRCCS) or mastoids (BUTE)), electromyogram (EMG) and electrocardiogram (ECG). Signals were sampled at 256 Hz, 12-bit A/D precision (IRCCS) or 1024 Hz, 12 bit A/D precision (BUTE), and stored on hard disk for further analysis.
EEG processing and slow wave detection
Second-night polysomnography recordings were visually scored on a 30-s basis based on standard criteria (Iber et al. 2007). Artifact-contaminated segments were rejected on a 4-s basis. CAP events were visually scored based on standard criteria (Terzano et al. 2001), but only CAP A1 events were considered due to their high SW content.
Slow waves were automatically detected using criteria based on previously described methodology (Massimini et al. 2004; Menicucci et al. 2009; Piantoni et al. 2013). Slow wave detection was performed in the following steps:
1.The signals of all EEG electrodes were band-pass filtered (0.5–4 Hz, two-way least-squares FIR filtering);
2. Large-amplitude SWs were detected on all electrodes as negative deflections on the filtered signal with a minimum amplitude of at least − 75 µV (Piantoni et al. 2013) and a duration of 0.2–1 s, followed by a positive deflection with a minimum peak-to-peak amplitude of 140 µV (Massimini et al. 2004);
3. Smaller SWs were detected on all electrodes as negative deflections on the filtered signal with a minimum amplitude of at least − 37.5 µV and a duration of 0.2–1 s, followed by a positive deflection with a minimum peak-to-peak amplitude of 75 µV;
4. Simultaneous detections on different electrodes (negative peaks separated by no more than 200 ms) were grouped together as a single traveling wave. Slow waves detected in (3) were only considered if they co-occurred with at least one large-amplitude wave detected in (2). SWs which were sub-threshold according to (2) on all electrodes were discarded. The location of the first peak in a concomitant SW group was identified as the electrode of origin, belonging to an region of origin. The amplitude of the first peak was defined as the amplitude at origin. Regions of origin were one of the following: frontal (Fp1, Fp2, F3, F4, Fz), central (C3, C4, Cz), parietal (P3, P4, Pz), occipital (O1, O2), left temporal (F7, T3, T5) or right temporal (F8, T4, T6). Lag was calculated for each SW and each electrode which registered a concomitant SW as the time difference between the wave peak at the electrode of origin and the electrode in question. Propagation was defined as the number of electrodes in a wave group which registered a SW according to either (2) or (3);
5. The following features were calculated within the SW groups for each individual electrode on which an SW was detected: local amplitude (maximum negative deflection in µV), wave slope steepness (descending downstate, ascending downstate, ascending upstate, descending upstate, in µV/s, defined as the ratio of the half-wave amplitude and the time difference between the zero crossing and the peak for descending slopes or vice versa for ascending slopes), and frequency (of the downstate, in Hz, expressed as 1 divided by the duration of the half-wave, multiplied by 2). A schematic depiction of SW parameters is given in Fig. 1;
6. For each wave, synchronization likelihood (SL) (Stam and van Dijk 2002) was calculated as a measure of EEG synchronization between the following electrode pairs, regardless of whether or not an SW was present on these electrodes: Fp1–Fp2, F3–F4, C3–C4, P3–P4, O1–O2 F7–F8, T3–T4, T5–T6 (interhemispheric synchronization) and F3–C3, C3–P3, P3–O1, F4–C4, C4–P4, P4–O2 (intrahemispheric synchronization), in line with previous studies which used this synchronization measure and these derivation pairs to investigate EEG synchronization during CAP (Ferri et al. 2005c, 2006). SL was chosen as a measure of both linear and nonlinear relationships between EEG data series, which arguably provide a more accurate understanding of neural dynamics (Terry et al. 2004).
Figure 1.
Fig. 1
Schematic SW with the detected wave features
The polarity of waves was visually confirmed, with steeper half-waves with greater amplitude identified as the downstate, and the half-wave containing spindles and other high-frequency oscillations as the upstate.
After detection, SWs were classified as either NCAP or CAP A1 based on whether their negative peak occurred during a visually detected CAP A1 event (SW type). Solitary waves (SWs not preceded or followed by another for at least 2 s) were excluded from the analysis because they were assumed to be K-complexes and possibly possess different morphological features than either NCAP or CAP A1 SWs.
Statistical analysis
Statistical analysis was designed to reveal SW type effects on the fine morphological features of SWs (Menicucci et al. 2009). All statistical analyses were performed in IBM SPSS Statistics 20.0.
Differences in the frequency of regions of origin were assessed using a χ2 test. SW type effects on the relative frequency of regions of origin were assessed using an additional row-wise z test.
For propagation, SW type effects were assessed by a univariate ANOVA model with propagation (the number of electrodes a wave is detected on) as the dependent variable; subject, SW type and region of origin as categorical predictors and amplitude at origin as a continuous predictor. Separate analyses were run for NREM 2 sleep (N2) and slow wave sleep (SWS).
For synchronization measures, SW type effects were assessed by a multivariate ANOVA model with SL between all electrode pairs entered as dependent variables and subject, SW type and region of origin as categorical predictors. Separate analyses were run for N2 and SWS.
For amplitude and frequency, SW type effects were assessed for each electrode by independent univariate ANOVAs with local amplitude or frequency on the given electrode as the dependent variable and subject, SW type and region of origin as categorical predictors. Separate analyses were run for N2 and SWS.
For lag, SW type effects were assessed for each electrode by independent univariate ANOVAs with lag on the given electrode as the dependent variable and subject and SW type as categorical predictors. Separate analyses were run for N2 and SWS as well as for each region of origin.
For the SW slopes, SW type effects were assessed for each electrode by independent univariate ANOVAs with slope steepness on the given electrode as the dependent variable; subject, SW type and region of origin as categorical predictors and amplitude at origin as a continuous predictor. The four wave slopes were analyzed independently and separate analyses were run for N2 and SWS.
In case of measures where the effects were tested by a series of univariate ANOVAs, a further correction of multiple comparisons was performed using a modified version of the Rüger area method, (Abt 1987; Hassainia et al. 1994) which is especially suited for EEG analysis where variables (in this case, data from neighboring electrodes) are expected to be strongly correlated and they are arranged into a well-defined spatial pattern (Bódizs et al. 2014; Ujma et al. 2016). According to the rules of this method, areas of potential significance were considered where SW type main effects were significant on at least two neighboring electrodes. This area of potential significance was considered significant as a whole if p for the main effect was < 0.05/2 in at least 50% of the cases or < 0.05/3 in at least 33% of the cases.
As most SW subtype differences were found in SWS rather than N2 (see “Results” for a detailed description), in the graphical presentation of results we focused on the effects measured in SWS.
Results
Basic wave features
We detected 61,426 individual SWs from the entire sample of subjects (on average 1660 per subject, SD 1050.6, range 178–3757). Of these, 23,104 were detected in N2 (18,979 in NCAP and 4125 in CAP A1) and 38,322 in SWS (25,318 in NCAP and 13,004 in CAP A1).
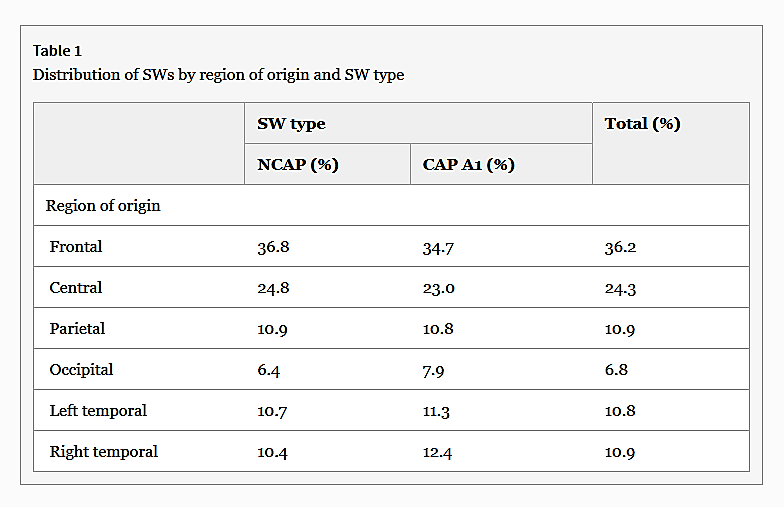
The detected waves were predominantly frontal in origin (χ2 = 128.81, p < 0.001). There was no difference in the distribution of region of origin of waves by SW type (row-wise z test, p > 0.05 for all cases). Table 1 summarizes the distribution of SW origins.
Propagation
In line with previous results (Menicucci et al. 2009), frontal SWs were the most local and occipital SWs the most widespread.
CAP A1 slow waves were detected on significantly more electrodes, as evidenced by a significant main effect of SW type (p < 0.001 in N2, p = 0.006 in SWS). The effects of subject, region of origin and amplitude were also significant in both sleep depths. The marginal mean number of electrodes a wave was detected on (corrected for the effects of other predictors) was 10.452 for NCAP and 11.477 for CAP A1 in N2 and 10.624 for NCAP and 11.367 for CAP A1 in SWS. Figure 2 illustrates the uncorrected propagation extent by electrode over the entire scalp. Note that this figure shows uncorrected means for each electrode. This is because performing individual ANOVAs for each electrode (as it was done for the other SW parameters) proved impractical, since for some subjects the number of SWs originating from certain rare locations was extremely low (N < 10), greatly reducing statistical power. This was not an issue for other SW parameters as most waves were detected on numerous electrodes, yielding SW parameters on all of them, but all SWs naturally only originated from a single electrode.
Fig. 2
SW propagation extent over the scalp by SW type in SWS. Topographic plots indicate the mean number of electrodes an SW originating from a given electrode was detected on
Figure 3 illustrates the relative propagation of SWs, that is, the probability of a SW to be detected at a given derivation based on its origin.
Fig. 3
Relative SW propagation over the scalp by region of origin and SW type in SWS. Topographic plots indicate the proportion of SWs detected on a given electrode out of every SW with the corresponding origin
Synchronization
In N2, beyond significant subject (p < 0.001 in all cases) and region of origin (all except Fp1–Fp2, F7–F8 and T3–T4) effects, SW type had no significant effect on synchronization.
In SWS, however, SW type had a significant effect on both interhemispheric (Fp1–Fp2, F3–F4, C3–C4, P3–P4, T3–T4, T5–T6) and intrahemispheric (F4–C4, P3–O1, P4–O2) synchronization. The effect was not significant for O1–O2, F7–F8 (interhemispheric) and F3–C3, C3–P3, C4–P4 (intrahemispheric). Subject (in all cases) and region of origin effects (all except F3–F4, F7–F8 and T3–T4) were also significant.
Figure 4 illustrates SW type effects on synchronization measures.
Fig. 4
Marginal means (corrected for the effects of subject and region of origin) of the synchronization likelihood of NCAP (left) and CAP A1 (right) SWs in SWS. Error bars represent 95% confidence intervals. Asterisks indicate significant SW type differences after correcting for multiple comparisons
Amplitude
After correcting for the effects of the other predictors, CAP A1 SWs were characterized by significantly greater amplitude on F4, Fz and C3 in N2 (however, not forming an area of significance), and on all electrodes except O2, T6, Pz, O1, T6 in SWS (forming an area of significance). Region of origin formed an area of significance in fronto-central area (Fp1, F3, C3, P3, F4, P4, Fz, Cz, Pz) in N2 and also in SWS (Fp1, F3, C3, P3, C4, P4, F8, T4, Fz, Cz, Pz). Subject effects were significant in all cases.
Figure 5 shows SW type effects on amplitude.
Fig. 5
Marginal means (corrected for the effects of subject and region of origin) of amplitude in SWS in NCAP (left) and CAP A1 (middle) SWs and the distribution of SW type main effects p values on the scalp (right). Significance levels are plotted on an inverted logarithmic scale to emphasize differences below the significance threshold. Only areas with significant differences are colorized, while areas where SW type main effects were not significant are left blank
Slope steepness
After correcting for the effects of other predictors (including amplitude, which greatly determines slope), CAP A1 SWs had significantly steeper slopes in some areas, especially in the later phases of SWs.
In N2, SW type had no significant main effect on either slope of the SW.
In SWS, the descending downstate slopes of CAP A1 SWs were steeper on F3, F4 and Cz, but the effect was not significant after correcting for multiple comparisons (pmin = 0.038). Ascending downstate slopes of CAP A1 SWs were steeper on Fp2, F4, F8, F3, C4 and Cz, forming an area of significance. Similarly, both ascending (Fp1, Fp2, F3, Fz, F4, C3, Cz, C4, Pz, T4) and descending (Fp1, Fp2, F3, Fz, F4, F7, C3, Cz) upstate slopes were steeper in CAP A1 SWs, both forming areas of significance.
Region of origin effects in N2 were mainly restricted to frontal areas (Fp1, Fp2, F3, Fz, F4, C3, Cz, C4, P3 in the descending downstate, all of these and also P4, Pz and T3 in the ascending downstate; Fp2, Fz, F4, C3, Cz, C4, F8 and P4 in the ascending upstate and all except P4, O2, T4, T6, Pz, F7, T3 and T5 in the descending upstate). In SWS region of origin effects were significant on all electrodes in the descending (except T5 and T6) and ascending (except T6) downstates. This was restricted to mainly fronto-central areas in the ascending (Fp1, Fp2, F3, Fz, F4, C3, C4, F7, F8, O2) and descending (Fp1, Fp2, F3, Fz, F4, Cz, Pz) upstates.
Subject effects were significant in all cases.
Figure 6 illustrates SW type effects on slope steepness.
Fig. 6
Marginal means of SW slopes (DDS descending downstate, ADS ascending downstate, AUS ascending upstate, DUS descending upstate, respectively; µV/s; corrected for the effects of subject, region of origin and amplitude at origin) for NCAP (left) and CAP A1 (middle) SWs in SWS. Topographic plots in the right column show the distribution of SW type main effects p values on the scalp. Significance levels are plotted on an inverted logarithmic scale to emphasize differences below the significance threshold. Only areas with significant differences after multiple comparisons correction are colorized, while areas where SW type main effects were not significant are left blank. p values below 0.001 were rounded up to 0.001 to ensure consistent and illustrative color ranges across plots
Lag
In both N2 and SWS, only SWs of a parietal origin showed a significant SW type effect, with a slightly different localization (Fp1, F3, F4 and F7 in N2 and F4, Fz and C4 in SWS, both significant areas after multiple comparisons correction). In both cases, marginal means indicate slower propagation speed in case of CAP A1 SWs.
Subject effects were significant in all cases.
Figure 7 illustrates SW type effects on lag in SWS.
Fig. 7
Marginal means of lag (corrected for the effects of subject) by region of origin in SWS for NCAP and CAP A1 SWs. Topographic plots in the third and sixth column show the distribution of SW type main effects p values on the scalp. Significance levels are plotted on an inverted logarithmic scale to emphasize differences below the significance threshold. Only areas with significant differences after multiple comparisons correction are colorized, while areas where SW type main effects were not significant are left blank
Frequency
SW type had no significant effect on frequency, either in N2 or SWS. Region of origin had no effect in N2, but it had a significant effect in a widespread area (Fp1, F3, Fz, C3, Cz, C4, P3, P4, F7, T3, T5, T6 and O2) in SWS. Subject effects were significant in all cases.
Figure 8 illustrates the absence of SW type effects on frequency.
Fig. 8
Marginal means of downstate frequency (corrected for the effects of subject and region of origin) in SWS for NCAP (left) and CAP A1 (middle) SWs in SWS. The topographic plot on the right illustrates the lack of significant SW type main effect p values on the scalp
Discussion
Our results highlight two important quantitative differences between NCAP and CAP A1 waves: the latter (1) exhibit greater synchronization, reflected by steeper slopes and greater interhemispheric and intrahemispheric synchronization (2) on average involve a greater area of the cerebral cortex, as evidenced by greater propagation.
Previous studies convincingly demonstrate that SWs recorded from corticographic field potentials and even from the scalp realistically represent the cellular slow oscillation, that is, neuronal silence (downstate, negative deflection on the scalp, positive deflection on corticography) followed by synchronized firing (upstate, positive deflection on the scalp, negative deflection on corticography) (Contreras and Steriade 1995b; Destexhe et al. 1999; Nir et al. 2011). Slow wave amplitude and slow wave globality are positively correlated (Nir et al. 2011), and the scalp topography of SWs reflects differences in the location of their cortical generators, as revealed by source localization methods (Murphy et al. 2009; Riedner et al. 2011). This suggests that the topography of SWs on the scalp is capable of revealing differences in the cortical generators of SW subtypes. We found that in CAP A1 the extent of SWs is greater, suggesting that a greater cortical area contributes to the generation of these waves, that is, in CAP A1 neuronal firing is synchronized over a greater proportion of the cortical mantle. Notably, this effect is significant even when correcting for the effects of amplitude, which is not only modestly but significantly correlated with wave propagation (r = − 0.144, p < 0.001), but also serves as the main selection criterion of CAP A1 SWs (Terzano et al. 2001). The presence of significant effects after amplitude correction suggests that greater propagation in CAP A1 is not merely because of a stratification effect.
CAP A1 SWs are characterized by steeper slopes, especially during the later phases of the wave, even after normalizing amplitude which evidently has an effect on slopes (on representative F4 r = − 0.145–0.45 depending on the slope, all p < 0.001) and which also serves as the main selection criterion of CAP A1 SWs. SW slope is an indicator of neuronal firing pattern synchronization and ultimately synaptic strength (Esser et al. 2007; Riedner et al. 2007): evoked potentials are larger and steeper after extended wakefulness, which is indicative of stronger synaptic connections (Huber et al. 2013; Vyazovskiy et al. 2008), evoked potential features correlate with SW features in subsequent sleep (Huber et al. 2007), and evoked SWs are larger and steeper early in the sleep before the restorative function of SWS can take place (Vyazovskiy et al. 2009). Descending SW slopes purportedly show the proportion of individual neurons synchronously entering the period of silence, while ascending slopes show the proportion entering the period of synchronized firing (Riedner et al. 2007). The properties of cortically detected subsequent ascending and descending slopes are only weakly correlated (Botella-Soler et al. 2012), suggesting that hyperpolarization and depolarization reflect different mechanisms. Therefore, it is reasonable to interpret steeper SW slopes in CAP A1 as further evidence for more synchronized neuronal firing compared to NCAP SWs, with particularly greater synchrony during depolarization in CAP A1.
Higher synchrony during CAP A1 is also supported by higher synchronization likelihood values between most derivation pairs, especially interhemispheric ones. This is in line with previous studies investigating EEG synchronization in CAP (Ferri et al. 2005c, 2006) which came to a similar conclusion. While these studies might be criticized for comparing CAP A1 (rich in SWs, highly synchronous phenomena) to CAP B (which is by definition contains less of these events), our new results indicate that such criticism would be unwarranted. Greater synchronization is present in CAP A1 even at the level of individual SWs.
SW characteristics reflect homeostatic sleep pressure (Tononi and Cirelli 2014): increased delta power in the sleep EEG is present when homeostatic pressure is high, such as after sleep deprivation (Borbely and Achermann 1999; Borbely et al. 1981) or in the early stages of sleep (Borbely and Achermann 1999; Lazar et al. 2015). Specific properties of (evoked) SWs are indicative of homeostatic pressure: under high levels of it, evoked SWs are larger, steeper and they are characterized by longer hyperpolarization (down-) states (Vyazovskiy et al. 2009). Both spontaneous and evoked CAP A1 events are also more prevalent during high homeostatic sleep pressure, while CAP A2 and A3 events predominate during low homeostatic pressure (Halasz et al. 2014; Parrino et al. 2012b; Terzano et al. 2005). In light of these findings, as well as the increased CAP rates during sleep perturbation with better neurocognitive function in case of higher CAP A1 rates (Ferri et al. 2010) and the reduction of CAP A1 after sleep deprivation due to the saturation of sleep-promoting mechanisms (De Gennaro et al. 2002), CAP A1 was recently ascribed a secondary, supportive homeostatic function (Halasz et al. 2014). In this view, CAP A1 would serve as a “slow wave injection” which mimics the effects of SWS in a transient, concentrated manner, maintaining sleep and promoting synaptic downscaling after sleep-disturbing events, as opposed to NCAP SWs which promote synaptic downscaling as a function of previous wakefulness. Our findings reveal that CAP A1 SWs are indeed characteristic of high homeostatic sleep pressure: large amplitudes, steep slopes and synchronization over distant areas (most probably all reflecting greater synchrony) are optimally suited for a concentrated, burst-like expression of SWS function. It must be noted, however, that we found no evidence for longer downstates in CAP A1 which had been reported in high homeostatic pressure SWs (Vyazovskiy et al. 2009) and slope differences, while not absent from the downstate, were more pronounced in the following upstate.
Greater synchrony of not only general EEG signals, but also the neuronal firing underlying SWs during CAP A1 would offer a tentative explanation of an important property of CAP: that is, its epileptogenic nature. Albeit the greater presence of CAP A1 is generally considered a positive sign (Bruni et al. 2010b; Parrino et al. 2012b), it entails an increased presence of epileptiform phenomena in epileptic patients, including interictal events and seizures (Bonakis and Koutroumanidis 2009; Gigli et al. 1992; Halasz et al. 2002; Parrino et al. 2012a; Terzano et al. 1989), with the notable exception of benign childhood epilepsies (Bruni et al. 2010a; Terzano et al. 1991). Interictal spikes occur more frequently during sleep with a high SW content (Frauscher et al. 2015; Ujma et al. 2015), and in epileptic patients occur during the hyperpolarizing phase of the SW where synchrony is the greatest (unlike virtually all other oscillations which occur during the depolarizing phase), suggesting that greater synchronization of neural firing is what sets off spikes (Frauscher et al. 2015). Importantly, in our recent study (Ujma et al. 2015), we did not only find that interictal spikes occurred approximately twice as often during CAP A1 as during NCAP NREM sleep, but that spike occurrence frequency only correlated with EEG delta power in CAP A1, suggesting a specific role of CAP slow activity in the generation of epileptiform phenomena.
Overall, our results indicate subtle but significant morphological differences between NCAP and CAP A1 slow waves which go beyond the parameters which serve as CAP A1 selection criteria. SWs in both NCAP and CAP A1 are similar in terms of their mostly frontal origin, frequency and general propagation pattern, but CAP A1 SWs are steeper, more widespread and they are characterized by greater EEG signal synchronization. All this is evidence for an overall greater synchronization of neural activity in CAP A1 SWs, which importantly involves a greater area of the cerebral cortex. Thus, CAP A1 SWs are potentially more important for the synaptic homeostasis of large, potentially multimodal cortical assemblies. Since SWs appear locally as a function of cortical activity in previous wakefulness (Esser et al. 2006; Huber et al. 2004, 2006), the widespread SWs which characterize CAP A1 may be preferentially involved in the processing of complex, possibly multimodal memory traces from previous wakefulness which are encoded across a wide network of cortical areas, while NCAP SWs may be related to the consolidation of functionally less complex experiences which are encoded in more local cortical assemblies. Two previous studies provide partial supporting evidence for this hypothesis. While the increase of delta power after a motor learning task was local and restricted to scalp areas over the contralateral motor cortex (Huber et al. 2004), a re-analysis of the same task also found an increase in CAP A1 occurrence after learning and a positive correlation between CAP A1 rate increase and post-sleep performance improvement (Ferri et al. 2008), suggesting the importance of CAP A1 in the consolidation of a relatively complex learned response pattern. However, further studies and a more direct testing of the hypothesis of the involvement of CAP A1 in the consolidation of complex experiences are still required, preferentially investigating the effects of CAP A1 on post-sleep cognitive performance as a function of varying task complexity.
While based on previous studies, we believe that it is reasonable to draw conclusions about cortical events based on scalp SWs as proxy measurements, in the absence of invasive recordings such evidence is necessarily indirect. Previous studies demonstrated that single-cell activity, multiple unit-activity, corticography or depth EEG and scalp EEG recordings correspond very closely during SWs (Botella-Soler et al. 2012; Csercsa et al. 2010; Nir et al. 2011), as well as that SW amplitude is related to SW propagation (Nir et al. 2011). However, all of these studies utilized multiple EEG registration methods including surgically implanted electrodes. While scalp SWs are thought to reflect invasively recorded corticographic, depth EEG and cell population activity (Riedner et al. 2007), this correspondence is necessarily imperfect. Our conclusions are therefore limited by the fact that due to the absence of invasive recordings it was impossible to obtain a direct measurement of SW generation at the single-neuron or neuron population level. Due to the local nature of most SWs, often only detectable on invasive recordings (Botella-Soler et al. 2012; Nir et al. 2011), our methods using scalp EEG certainly did not detect the full range of SWs generated by the cortex over the night. Therefore, our results are representative only for the large SWs detected by scalp EEG. We attempted to compensate for these limitations by recruiting a large number of subjects (N = 37). Furthermore, human corticography is normally only possible in epileptic patients undergoing presurgical monitoring, but our scalp EEG study was conducted in healthy volunteers. Another shortcoming of our results is that the CAP A1 effects described above were predominantly seen in SWS and not in N2. During N2, SWs have higher amplitude on average (− 76.22 vs. 72.8 µV during SWS, t = 11.94, p < 0.001, equal variances not assumed), but amplitude is also more variable (SD = 36.2 vs. 31.37 µV during SWS, Levene’s F = 213.2, p < 0.001). Therefore, we speculate that SWs in N2, a sleep stage of intermediate depth and intermittent slow wave activity, are naturally more variable and exhibit characteristic NCAP/CAP differences less consistently.
Funding
This study was funded by the 2017-1.2.1-NKP-2017-00002 grant. Péter P. Ujma and Péter Simor were supported by the ÚNKP-17-4 New National Excellence Program of the Ministry of Human Capacities. Péter Simor was supported by the European Union and the State of Hungary, co-financed by the European Social Fund in the framework of TÁMOP 4.2.4A/-11-1-2012-0001 ‘National Excellence Program’ and by the János Bolyai Research Scholarship of the Hungarian Academy of Sciences.
Compliance with ethical standards
Conflict of interest
The authors declare no conflict of interest.
References
Abt K (1987) Descriptive data analysis: a concept between confirmatory and exploratory data analysis. Methods Inf Med 26:77–88
Amzica F, Steriade M (1995) Disconnection of intracortical synaptic linkages disrupts synchronization of a slow oscillation. J Neurosci Off J Soc Neurosci 15:4658–4677
Aricò D, Drago V, Foster PS, Heilman KM, Williamson J, Ferri R (2010) Effects of NREM sleep instability on cognitive processing. Sleep Med 11:791–798. https ://doi.org/10.1016/j.sleep.2010.02.009
Bódizs R, Gombos F, Ujma PP, Kovács I (2014) Sleep spindling and fluid intelligence across adolescent development: sex matters. Front Hum Neurosci https ://doi.org/10.3389/fnhum .2014.00952
Bonakis A, Koutroumanidis M (2009) Epileptic discharges and phasic sleep phenomena in patients with juvenile myoclonic epilepsy. Epilepsia 50:2434–2445
Borbely AA, Achermann P (1999) Sleep homeostasis and models of sleep regulation. J Biol Rhythms 14:557–568
Borbely AA, Baumann F, Brandeis D, Strauch I, Lehmann D (1981) Sleep deprivation: effect on sleep stages and EEG power density in man. Electroencephalogr Clin Neurophysiol 51:483–495
Botella-Soler V, Valderrama M, Crépon B, Navarro V, Le Van Quyen M (2012) Large-scale cortical dynamics of sleep slow waves. PloS one 7:e30757. https ://doi.org/10.1371/journ al.pone.00307 57
Bruni O et al (2010a) Reduced NREM sleep instability in benign childhood epilepsy with centro-temporal spikes. Clin Neurophysiol Off J Int Fed Clin Neurophysiol 121:665–671
Bruni O, Novelli L, Miano S, Parrino L, Terzano MG, Ferri R (2010b) Cyclic alternating pattern: a window into pediatric sleep. Sleep Med 11:628–636. https ://doi.org/10.1016/j.sleep .2009.10.003
Carrier J, Land S, Buysse DJ, Kupfer DJ, Monk TH (2001) The effects of age and gender on sleep EEG power spectral density in the middle years of life (ages 20–60 years old). Psychophysiology 38:232–242. https ://doi.org/10.1111/1469-8986.38202 32
Chauvette S, Volgushev M, Timofeev I (2010) Origin of active states in local neocortical networks during slow. sleep oscillation. Cereb Cortex 20:2660–2674. https ://doi.org/10.1093/cerco r/bhq00 9
Contreras D, Steriade M (1995a) Cellular basis of EEG slow rhythms: a study of dynamic corticothalamic relationships. J Neurosci Off J Soc Neurosci 15:604–622
Contreras D, Steriade M (1995b) Cellular basis of EEG slow rhythms: a study of dynamic corticothalamic relationships. J Neurosci 15:604–622
Crunelli V, Hughes SW (2010) The slow (< 1 Hz) rhythm of non-REM sleep: a dialogue between three cardinal oscillators. Nat Neurosci 13:9–17. https ://doi.org/10.1038/nn.2445
Csercsa R et al (2010) Laminar analysis of slow wave activity in humans. Brain 133:2814–2829
David F et al (2013) Essential thalamic contribution to slow waves of natural sleep. J Neurosci Off J Soc Neurosci 33:19599–19610
De Gennaro L, Ferrara M, Spadini V, Curcio G, Cristiani R, Bertini M (2002) The cyclic alternating pattern decreases as a consequence of total sleep deprivation and correlates with. EEG arousals. Neuropsychobiology 45:95–98
Destexhe A, Contreras D, Steriade M (1999) Spatiotemporal analysis of local field potentials and unit discharges in cat cerebral cortex during natural wake and sleep states. J Neurosci 19:4595–4608
Drago V, Foster PS, Heilman KM, Aricò D, Williamson J, Montagna P, Ferri R (2011) Cyclic alternating pattern in sleep and its relationship to creativity. Sleep Med 12:361–366. https ://doi.
org/10.1016/j.sleep .2010.11.009
Esser SK, Huber R, Massimini M, Peterson MJ, Ferrarelli F, Tononi G (2006) A direct demonstration of cortical LTP in humans: a combined TMS/EEG study. Brain Res Bull 69:86–94
Esser SK, Hill SL, Tononi G (2007) Sleep homeostasis and cortical synchronization: I. Modeling the effects of synaptic strength on sleep slow waves. Sleep 30:1617–1630
Ferini-Strambi L, Ortelli P, Castronovo V, Cappa S (2004) Increased periodic arousal fluctuations during non-REM sleep are associated to superior memory. Brain Res Bull 63:439–442
Ferri R, Bruni O, Miano S, Plazzi G, Terzano MG (2005a) All-night EEG power spectral analysis of the cyclic alternating pattern components in young adult subjects. Clin Neurophysiol Off J Int Fed Clin Neurophysiol 116:2429–2440
Ferri R, Bruni O, Miano S, Terzano MG (2005b) Topographic mapping of the spectral components of the cyclic alternating pattern (CAP). Sleep Med 6:29–36
Ferri R, Rundo F, Bruni O, Terzano MG, Stam CJ (2005c) Dynamics of the EEG slow-wave synchronization during sleep. Clin Neurophysiol Off J Int Fed Clin Neurophysiol 116:2783–2795
Ferri R, Rundo F, Bruni O, Terzano MG, Stam CJ (2006) Regional scalp EEG slow-wave synchronization during sleep cyclic alternating pattern A1 subtypes. Neurosci Lett 404:352–357
Ferri R et al (2008) The slow-wave components of the cyclic alternating pattern (CAP) have a role in sleep-related learning processes. Neurosci Lett 432:228–231. https ://doi.org/10.1016/j.neulet.2007.12.025
Ferri R, Drago V, Arico D, Bruni O, Remington RW, Stamatakis K, Punjabi NM (2010) The effects of experimental sleep fragmentation on cognitive processing. Sleep Med 11:378–385
Frauscher B, von Ellenrieder N, Ferrari-Marinho T, Avoli M, Dubeau F, Gotman J (2015) Facilitation of epileptic activity during sleep is mediated by high amplitude slow waves. Brain 138:1629–1641
Geiger A, Huber R, Kurth S, Ringli M, Jenni OG, Achermann P (2011) The sleep EEG as a marker of intellectual ability in school age children. Sleep 34:181–189
Gigli GL et al (1992) Sleep microstructure and EEG epileptiform activity in patients with juvenile myoclonic epilepsy. Epilepsia 33:799–804
Halasz P, Terzano MG, Parrino L (2002) Spike-wave discharge and the microstructure of sleep–wake continuum in idiopathic generalised epilepsy. Neurophysiol Clin 32:38–53
Halasz P, Bodizs R, Parrino L, Terzano M (2014) Two features of sleep slow waves: homeostatic and reactive aspects—from long term to instant sleep homeostasis. Sleep Med 15:1184–1195
Hassainia F, Petit D, Montplaisir J (1994) Significance probability mapping: the final touch in t-statistic mapping. Brain Topogr 7:3–8
Hirshkowitz M (2002) Arousals and anti-arousals. Sleep Med 3(3):203–204
Huber R, Felice Ghilardi M, Massimini M, Tononi G (2004) Local sleep learning Nature 430:78–81
Huber R, Ghilardi MF, Massimini M, Ferrarelli F, Riedner BA, Peterson MJ, Tononi G (2006) Arm immobilization causes cortical plastic changes and locally decreases sleep slow wave activity. Nat Neurosci 9:1169–1176. http://www.nature.com/neuro /journal/v9/n9/suppi nfo/nn175 8_S1.html
Huber R, Esser SK, Ferrarelli F, Massimini M, Peterson MJ, Tononi G (2007) TMS-induced cortical potentiation during wakefulness locally increases slow wave activity during sleep. PloS one 2:e276. https ://doi.org/10.1371/journ al.pone.00002 76
Huber R et al (2013) Human cortical excitability increases with time awake. Cereb cortex 23:1–7
Iber C, Ancoli-Israel S, Chesson A, Quan S (2007) The AASM manual for the scoring of sleep and associated events: rules, terminology and technical specification, 1st edn. American Academy of Sleep
Medicine, Westchester
Lazar AS, Lazar ZI, Dijk DJ (2015) Circadian regulation of slow waves in human sleep: topographical aspects. Neuroimage 116:123–134
Massimini M, Huber R, Ferrarelli F, Hill S, Tononi G (2004) The sleep slow oscillation as a traveling wave. J Neurosci Off J Soc Neurosci 24:6862–6870
Menicucci D, Piarulli A, Debarnot U, d’Ascanio P, Landi A, Gemignani A (2009) Functional structure of spontaneous sleep slow oscillation activity in humans. PloS one 4:e7601 https ://doi.org/10.1371/journ al.pone.00076 01
Murphy M, Riedner BA, Huber R, Massimini M, Ferrarelli F, Tononi G (2009) Source modeling sleep slow waves. Proc Natl Acad Sci USA 106:1608–1613. https ://doi.org/10.1073/pnas.08079 33106
Nir Y, Staba RJ, Andrillon T, Vyazovskiy VV, Cirelli C, Fried I, Tononi G (2011) Regional slow waves spindles in human sleep. Neuron 70:153–169
Parrino L et al (2012a) Distinctive polysomnographic traits in nocturnal frontal lobe epilepsy. Epilepsia 53:1178–1184
Parrino L, Ferri R, Bruni O, Terzano MG (2012b) Cyclic alternating pattern (CAP): the marker of sleep instability. Sleep Med Rev 16:27–45
Piantoni G, Poil SS, Linkenkaer-Hansen K, Verweij IM, Ramautar JR, Van Someren EJ, Van Der Werf YD (2013) Individual differences in white matter diffusion affect sleep oscillations. J Neurosci Off J Soc Neurosci 33:227–233
Riedner BA, Vyazovskiy VV, Huber R, Massimini M, Esser S, Murphy M, Tononi G (2007) Sleep homeostasis and cortical synchronization: III. A high-density EEG study of sleep slow waves in humans. Sleep 30:1643–1657
Riedner BA, Hulse BK, Murphy MJ, Ferrarelli F, Tononi G (2011) Temporal dynamics of cortical sources underlying spontaneous and peripherally evoked slow waves. Progress Brain Res 193:201–218. https ://doi.org/10.1016/b978-0-444-53839 -0.00013 -2
Stam CJ, van Dijk BW (2002) Synchronization likelihood: an unbiased measure of generalized synchronization in multivariate data sets. Phys D Nonlinear Phenom 163:236–251. https://doi.org/10.1016/S0167 -2789(01)00386 -4
Steriade M, Nunez A, Amzica F (1993) A novel slow (< 1 Hz) oscillation of neocortical neurons in vivo: depolarizing and hyperpolarizing components. J Neurosci Off J Soc Neurosci 13:3252–3265
Terry JR, Anderson C, Horne JA (2004) Nonlinear analysis of EEG during NREM sleep reveals changes in functional connectivity due to natural aging. Hum Brain Mapp 23:73–84
Terzano MG, Parrino L, Anelli S, Halasz P, Portera-Sánchez A (1989) Modulation of generalized spike-and-wave discharges during sleep by cyclic alternating pattern. Epilepsia 30:772–781. https ://doi.org/10.1111/j.1528-1157.1989.tb053 37.x
Terzano MG, Parrino L, Fioriti G, Orofiamma B, Depoortere H (1990) Modifications of sleep structure induced by increasing levels of acoustic perturbation in normal subjects. Electroencephalogr Clin Neurophysiol 76:29–38
Terzano MG, Parrino L, Spaggiari MC, Barusi R, Simeoni S (1991) Discriminatory effect of cyclic alternating pattern in focal lesional and benign rolandic interictal spikes during sleep. Epilepsia 32:616–628
Terzano MG et al (2001) Atlas, rules, and recording techniques for the scoring of cyclic alternating pattern (CAP) in human sleep. Sleep Med 2:537–553
Terzano MG, Parrino L, Rosa A, Palomba V, Smerieri A (2002) CAP and arousals in the structural development of sleep: an integrative perspective. Sleep Med 3:221–229
Terzano MG, Parrino L, Smerieri A, Carli F, Nobili L, Donadio S, Ferrillo F (2005) CAP and arousals are involved in the homeostatic and ultradian sleep processes. J Sleep Res 14:359–368
Timofeev I, Steriade M (1996) Low-frequency rhythms in the thalamus of intact-cortex and decorticated cats. J Neurophysiol 76:4152–4168
Timofeev I, Grenier F, Bazhenov M, Sejnowski TJ, Steriade M (2000) Origin of slow cortical oscillations in deafferented cortical slabs. Cereb Cortex 10:1185–1199. https ://doi.org/10.1093/cercor/10.12.1185
Tononi G, Cirelli C (2014) Sleep and the price of plasticity: from synaptic and cellular homeostasis to memory consolidation and integration Neuron 81:12–34. https ://doi.org/10.1016/j.neuron.2013.12.025
Ujma PP et al (2015) Increased interictal spike activity associated with transient slow wave trains during non-rapid eye movement sleep. Sleep Biol Rhythms 13:155–162. https ://doi.org/10.1111/sbr.12101
Ujma PP, Sandor P, Szakadat S, Gombos F, Bodizs R (2016) Sleep spindles and intelligence in early childhood-developmental and trait-dependent aspects. Dev Psychol 52:2118–2129
Ujma PP et al (2017) The sleep EEG spectrum is a sexually dimorphic marker of general intelligence. Sci Rep 7:18070. https ://doi.org/10.1038/s4159 8-017-18124 -0
Vyazovskiy VV, Riedner BA, Cirelli C, Tononi G (2007) Sleep homeostasis and cortical synchronization: II. A local field potential study of sleep slow waves in the rat Sleep 30:1631–1642
Vyazovskiy VV, Cirelli C, Pfister-Genskow M, Faraguna U, Tononi G (2008) Molecular and electrophysiological evidence for net synaptic potentiation in wake and depression in sleep. Nat Neurosci 11:200–208
Vyazovskiy VV, Faraguna U, Cirelli C, Tononi G (2009) Triggering slow waves during NREM sleep in the rat by intracortical electrical stimulation: effects of sleep/wake history and background activity. J Neurophysiol 101:1921–1931