Sleep and Biological Rhythms 13(2): 155-162 (2015)
DOI: 10.1111/sbr.12101
Péter Przemyslaw Ujma1,2, Péter Simor3,4, Raffaele Ferri5, Dániel Fabó6, Anna Kelemen6, Loránd Erőss2, Róbert Bódizs1,7, Péter Halász6
1 Institute of Behavioural Sciences, Semmelweis University, Budapest, Hungary
2 Department of Functional Neurosurgery, National Institute of Clinical Neuroscience, , Budapest, Hungary
3 Department of Cognitive Sciences, Budapest University of Technology and Economics, , Budapest, Hungary
4 Nyírő Gyula Hospital, National Institute of Psychiatry and Addictions, , Budapest, Hungary
5 Sleep Research Centre, Department of Neurology I.C., Oasi Institute for Research on Mental Retardation and Brain Aging (IRCCS), , Troina, Italy
6 Department of Neurology, National Institute of Clinical Neuroscience, Epilepsy Centrum, , Budapest, Hungary
7 Department of General Psychology, Pázmány Péter Catholic University, , Piliscsaba, Hungary
Correspondence: Mr Péter Przemyslaw Ujma, H-1089 Budapest, Nagyvárad tér 4. Email: peteru88@gmail.com
Abstract
Non-rapid eye movement (NREM) sleep is characterized by recurring transient events (Cyclic Alternating Patterns, CAP), some of which consist of increased slow wave activity (A1 subtype). Such transient slow-wave events may play an important role in NREM sleep regulation and are known to facilitate epileptiform activity. In our study we investigated the relationship between interictal spike activity and Cyclic Alternating Patterns in three epileptic patients, using simultaneous scalp electroencephalogram (EEG) recording and intracranial electrocorticography. A significant increase of interictal activity was found during CAP A1 subtypes. A positive correlation between scalp EEG delta power and spike activity was found only in CAP A1 subtypes, but not during other events. These results show that transient (but not subcontinuous) delta activity has a facilitating effect on epileptoform activity, also suggesting a functional dissociation between morphologically similar delta activities.
Key words: Cyclic Alternating Pattern, electroencephalogram power analysis, epilepsy, interictal spikes, intracranial corticography, non-rapid eye movement sleep.
Introduction
Alterations in sleep architecture are frequent in epilepsy;1,2 furthermore, the facilitating effect that nonrapid eye movement (NREM) sleep exerts on some types of interictal epileptiform discharges (IEDs) is welldocumented and established.3 Nevertheless, NREM sleep is a highly heterogeneous state that can be characterized by a wide variety of microstructural events and neural oscillations. One important aspect of NREM sleep heterogeneity is the difference between ordinary and “reactive” slow wave activity.4 Reactive slow wave activity is an essential part of the Cyclic Alternating Pattern (CAP) concept that was introduced by Terzano and colleagues5 who aimed to define and classify the recurring patterns of transient electroencephalogram (EEG) activations during NREM sleep.6 Cyclic Alternating Pattern sequences are characterized by repeated phasic EEG activity bursts that are different from the background EEG and recur in quasiperiodic sequences, with inter-burst intervals up to 2 min. These sequences, composed of different oscillatory activities, show an alternating pattern of activation (A phases) and deactivation (B phases).5 These transient bursts of phasic events are categorized into different subtypes, based on their frequency content. The subtype A1 is a burst of synchronized delta waves generated at anterior sites with frequency components predominantly between 0.25–2.5 Hz.7 The A1 subtype appears preferentially during the descending slope of sleep, and reflects the instantaneous regulation and promotion of sleep depth.4,8 The subtype A2 is a mixture of synchronized delta oscillations and higher (alpha and beta) frequency activities, while in the A3, high frequency oscillations are the predominant activities. The higher frequency components of A2 and A3 are generated in posterior sites, while A1 and the slow component of A2 are characterized by anterior predominance.7 Although the vegetative components indicate a clear activation during A1 episodes, these events seem to be strongly related to sleep-promotion (anti-arousals), reflecting the effort of the cortex to preserve sleep continuity.4,9 Experimental evidence indicates that slow waves nested within the CAP A1 phases bear the features of reactive slow waves that might be functionally different from the subcontinuous slow-wave activity seen in NCAP NREM sleep. Specifically, CAP A1 subtypes were shown to be associated with bouts of transient, highlevel synchronization in slow wave activity involving primarily the anterior parts of the brain.10 Application of sound stimuli during the CAP phase B can change the EEG activity from phase B to phase A;11 similar evidence exists about the behavior of K-complexes (other important components of CAP A1 subtypes) which can be elicited by sound stimuli.12 Further evidence for the existence of reactive slow waves stems from studies demonstrating artificial boosting of slow waves by transcranial stimulation13 and by sounds or vibrations.14 While CAP patterns and K-complexes also occur in the absence of intentional external stimulation, we cannot rule out the possibility that at least some of them might reflect reactive events following hypothetical afferent inputs from the periphery. Several studies have revealed that almost all IEDs belonging to idiopathic major epilepsies and also to several symptomatic epilepsies occur preferentially during the A phase of CAP.4,15–20 Only IEDs of benign childhood epilepsy with centro-temporal spikes (BCTE) do not seem to show any apparent relationship with CAP events (although their number is characteristically elevated during NREM sleep).21,22 Further studies showed that interictal bursts are mostly associated with the A1 subtype.6 However, CAP-related changes in the interictal spiking abundantly seen in temporal lobe epilepsy and in cortical dysplasias were never systematically investigated before. Furthermore, all previous studies were based on scalp EEG recordings and no research was devoted to study this relationship with implanted electrodes, which could have explored spiking activity of a given cortical area in its entirety, avoiding the distorting effects of volume conduction by the skull and other tissues. Moreover, previous studies mostly relied on visual identification of phasic event patterns and, more importantly, did not apply detailed signal analysis procedures to explore the precise relationship between interictal spike activity and changes of the EEG spectrum during CAP events. Therefore, the aim of the present study was to investigate the relationship between interictal spiking and CAP based on electrocorticographic recordings. Moreover, we aimed to assess the EEG spectral power correlates of interictal spiking during the A1 and B phase of CAP and NCAP conditions.
Materials and methods
In this work we analyzed simultaneously recorded sleep EEG from frontal scalp areas and surgically implanted intracranial subdural electrodes in three patients: two with focal cortical epilepsies with underlying cortical dysplasia and one with medio-temporal epilepsy due to hippocampal sclerosis with cortical dysplasia. Intracranial EEG (icEEG) was recorded via subdural strip and grid electrodes implanted over the presumed epileptogenic area. The implantation procedure and the location of the electrodes was part of the presurgical evaluation of the patients, and was not biased by scientific purposes. Ad-tech (Racine, WI, USA) strip and grid electrodes were used. For Patient 1 and 2, two frontal scalp EEG (scEEG) electrodes (Fp1 and Fp2 for Patient 1, F3 and F4 fo Patient 2), electromyography and electrocardiography recordings were used for recording. For Patient 3, 14 scEEG electrodes (Fp1, Fpz, F3, F4, Fz, C3, C4, Cz, P3, P4, Pz, T5, O1 and O2) as well as electromyography and electrocardiography recordings were used for recording. ScEEG and icEEG was co-recorded using Brain-quick System Plus (Micromed SpA, Mogliano-Veneto, Italy) LTM system. Common extracranial reference was positioned at the contralateral mastoid. Sampling rate was 1024 Hz, hardware filters were set between 0.3 and 300 Hz. Recordings were amplified and digitized with 22-bit resolution. All interventions were approved by the hospital’s ethics committee in accordance with the Declaration of Helsinki.
The first patient, a 31-year-old female, had focal epilepsy since the age of 13 years with complex symptomatology starting with left hemiparaesthesia followed by hypermotor beating movements of the right extremities, alternating head turning and later dominated by tonic extension of the left side of the body accompanied by intensive pain, ending by laughing-like sounds, sometimes uttering inappropriate words. The seizures appeared mostly during sleep. Interictal EEG showed frequent right parieto-temporal posterior perisylvian spiking and ictal theta activity was seen over a wide right parietal area, preceded by EEG desynchronization of the same areas. Structural magnetic resonance imaging (MRI) did not show abnormalities, but postprocessing morphometry revealed an abnormal region behind the postcentral gyrus at the parietal operculum and posterior insular area. FDG-PET (18-Fluoro-deoxyglucose positron emission tomography) revealed a hypometabolic region involving the right parietal, insular and posterior temporal structures. Since the patient’s seizures showed complete therapy resistance for all available antiepileptic drugs over the years of her treatment, she was explored by invasive presurgical seizure monitoring. Both the posterior parietal convexity and interhemispheric surface was explored by subdural grids and the insular surface was additionally explored by a deep electrode. The seizure onset zone involved the posterior opercular and posterior insular region and was removed by open surgery. The patient has been seizure-free for 10 months with her previous combined antiepileptic drug therapy. Histology showed cortical dysplasia Type 2B. Spikes were recorded by electrodes over the posterior operculum. During presurgical monitoring, the patient received the following polytherapeutical drug regime: levatiracetam (2000 mg daily), lacosamide (300 mg daily), topiramate (200 mg daily), clobazam (10 mg daily).
The second patient, a 13-year-old boy, started to have focal seizures at the age of 7 years characterized by a left hand tingling sensation followed by left hand clonus and left arm elevation. Interictal EEG showed right central spiking and MRI revealed right postcentral focal abnormal gyrification with increased signal intensity on the fluid-attenuated inversion recovery (FLAIR) images. Seizures did not respond to antiepileptic treatment and the patient underwent invasive presurgical evaluation by an implanted subdural grid, placed over the right centro-parietal convexity. The location of the seizure onset zone was typical for focal sensori-motor seizures (involving the left hand, arm and sometimes the face area) and overlapped the dyplastic MRI lesion in the postcentral hand area. Motor cortex was involved only secondarily and motor hand and arm representation could be delineated. The sensory arm area, together with the dysplastic lesion was surgically resected and cortical dysplasia type 2B was found at histology. The seizures ceased after surgery and the patient has been aura and seizure free for 14 months. After surgery he had notable propriomotor deficit symptoms and consequent ataxia in the left hand and arm, which continuously improved and eventually ceased after 4 months of intensive rehabilitation treatment. The interictal spiking analyzed in this study was recorded with subdural grid electrodes from the parietal hand area in the vicinity of the seizure onset zone during NREM sleep. During presurgical evaluation, the patient received the following drug treatment: oxcarbazepine (900 mg daily) and carbamazepine (450 mg daily). The third patient, a 19-year-old female, had right temporo-medial epilepsy with seizures starting at 12 years of age, preceded by a peculiar change in her relation to the environment, sometimes having a feeling of fearsome loneliness, followed by a feeling of warmness, face flush with arrest and oral automatisms. The right hand became slightly dystonic. During the seizures the patient was unable to communicate verbally, not understanding and not responding to speech. Occasionally her partial seizures became generalized. MRI revealed left hippocampal sclerosis with a suspicion of temporopolar dysgenesis. FDG-PET showed left temporomedial polar hypometabolism. Several antiepileptic drug treatment attempts with all available drugs and rational combinations of them were unsuccessful. Therefore, the patient underwent presurgical seizure monitoring with subdural strip electrodes implanted over the temporo-lateral and medial regions of both temporal lobes. The onset zone of typical seizure manifestations was the left temporo-medial region. On one occasion the electrical stimulation of the anterior temporo-medial electrodes elicited clinical seizure manifestations from the right temporal lobe too, but spontaneous seizures were never observed from the right side. The left temporal pole, amygdala and head of hippocampus were surgically removed. Histology confirmed hippocampal sclerosis. After surgery the patient remained seizure free for the 11-month follow-up period, keeping her antiepileptic drug treatment. Spikes were recorded by strip over the parahippocampal region. During presurgical evaluation, the patient received the following polytherapeutic drug regime: phenytoin (250 mg daily), lamotrigin (300 mg daily) and clobazam (20 mg daily).
In all three patients, available seizure-free night-time recordings of pre-surgical EEG monitoring were analyzed. A total of 4.05 hours of data (64.7% N2+SWS) was analyzed for Patient 1, 6.98 hours (82.3% N2+SWS) for Patient 2 and 29.55 minutes (100% N2+SWS) for Patient 3. Wakefulness, sleep stages (N1, N2, SWS and REM) and conventional measures of sleep architecture were identified visually based on standard criteria.23 Because of the limitations to this process due to the few EEG electrodes and the lack of electrooculography, sleep scorings were only used to select N2 and SWS data for analysis, which could be reliably found based on the presence of delta waves, K-complexes and sleep spindles on the available frontal EEG channels.
CAP scoring
Cyclic Alternating Patterns were detected during NREM sleep periods according to the criteria described by Terzano and colleagues.24 Data from implanted electrodes (and therefore interictal spikes) were not visible for the CAP rater. CAP sequences were defined as three or more A phases separated from each other by a B phase no longer than 1 min. Apart from CAP A phases, CAP B segments were selected for further analyses as the periods between two successive CAP A phases. The remaining NREM sleep segments were defined as NCAP (NCAP). While the length of CAP A phases and CAP B segments was variable and clearly defined by their distinguishing characteristics, NCAP was split up to 20 s segments, and a NCAP period was always defined as an EEG segment with a fixed length of 20 s, completely devoid of either CAP A phases or CAP B events. CAP A phases were categorized into different subtypes based on their frequency content. Subtype A1 was scored if the event was characterized by the predominance of low-frequency/high-amplitude (slow components) EEG activity. In A1, high-frequency/lowamplitude activity (fast components) occupied less than 20% of the entire A phase duration. If EEG fast components occupied 20–50% of the segment, the A2 subtype, reflecting a mixture of the two EEG components, was marked. A3 subtype was scored if the sequence was predominantly (more than 50%) characterized by highfrequency/low-amplitude activity. CAP detection was carried out by means of the sleep analysis software Hypnolab 1.2 (SWS Soft, Italy). Completely CAP-free 20-s N2 and SWS EEG segments were analyzed as NCAP.
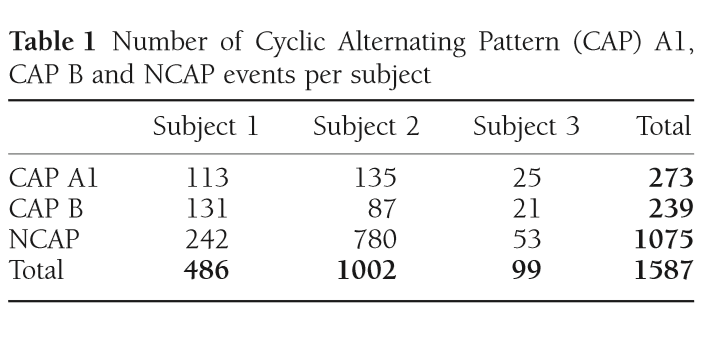
Table 1 Number of Cyclic Alternating Pattern (CAP) A1, CAP B and NCAP events per subject
The exact number of CAP A1 phases, CAP B and NCAP events per subject is reported in Table 1. Due to the low number of available CAP A2 phases (38 from Patient 1 and 2 each, 0 from Patient 3) and CAP A3 phases (21 from Patient 1, 4 from Patient 2 and one from Patient 3), these CAP subtypes were not included in the analysis.
Spike detection
For the simplicity of automated analysis, the EEG recordings of all electrodes were segmented to 0.25 s epochs. Multiple interictal spikes were unlikely to occur within this time frame. Each 0.25 s EEG segment was assigned a value of 0 or 1 depending on whether or not it contained a spike. Interictal spikes were detected by applying an individually adjusted amplitude criterion to the 3-Hz highpass-filtered EEG recorded from intracranial electrodes. If the voltage in a given 0.25 s segment was higher than the amplitude criterion at any point on any electrode, the EEG segment was considered to contain a spike. Automatic spike detections were always confirmed visually by an experienced rater. Spike rate was expressed as the ratio of 0.25 s segments within a CAP or NCAP event where a spike was detected, and therefore varied between 0 and 1.
EEG spectral analysis
Spectral EEG analysis was performed using the Fast Fourier Transform method on Hanning-windowed EEG segments from frontal scalp electrodes (Fp1 and Fp2 for Patient 1 and 3, F3 and F4 for Patient 2). In case of CAP A phases, which had variable lengths, a series of 2 s Hanning windows were used until the last complete 2 s window could be fitted to the event. CAP B events were similarly analyzed using 2 s Hanning windows, but the first and last two complete 2 s segments were excluded from analysis to exclude the potential influence of preceding and upcoming CAP A phases. For NCAP segments, each with a pre-determined length of 20 s, a series of 10 2-s Hanning windows was used. For all CAP A1, CAP B or NCAP segments, power spectral density from both scalp EEG electrodes was averaged within each segment.
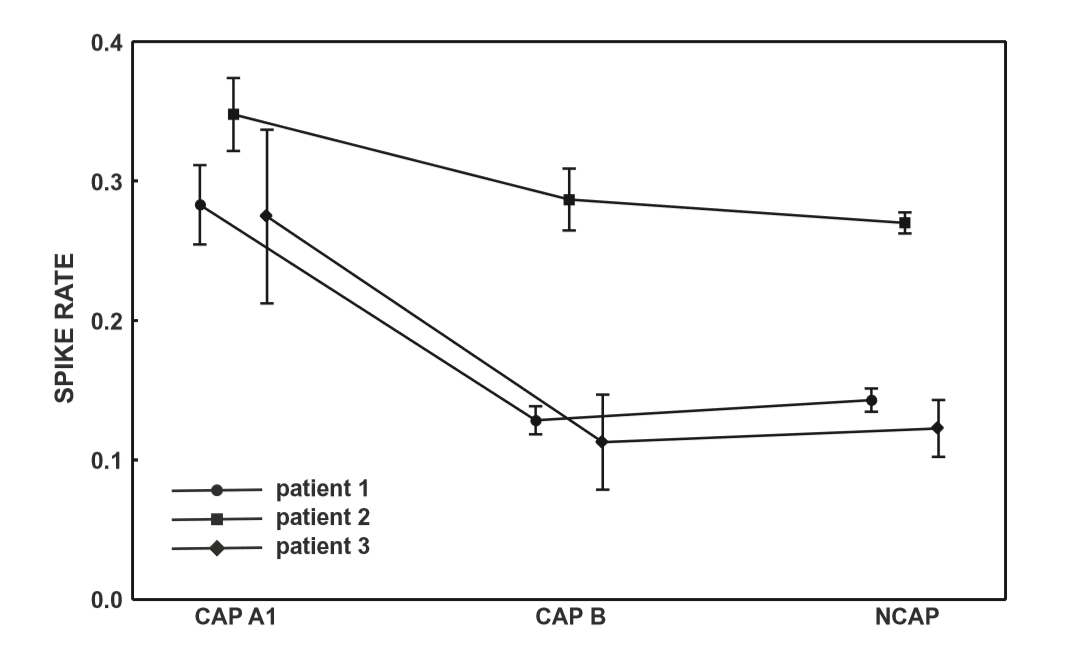
Figure 1 Spike rate (spikecontaining electroencephalogram (EEG) segments/all EEG segments) across Cyclic Alternating Pattern (CAP) subtypes and NCAP. Markers represent mean spike rate. Whiskers represent the 95% confidence intervals of spike rate.
Statistical analyses
Statistical analysis was completed independently for all three subjects involved in the study. Correlation analysis was not performed in data from Patient 3 due to the low number of CAP events available. Spike rates across CAP types and NCAP were compared using a one-way ANOVA model and Fisher’s Least Significant Differences method for post-hoc comparisons. The relationship between EEG power spectral density (between 0.5 Hz and 30 Hz) and spike rate was calculated using Spearman’s rank correlation coefficient. In order to correct for multiple comparisons due to the large number of frequency bins, the BenjaminiHochberg method25 of false discovery rate correction was implemented on the correlation P-values, for each CAP type/NCAP.
Results
CAP A1 vs NCAP
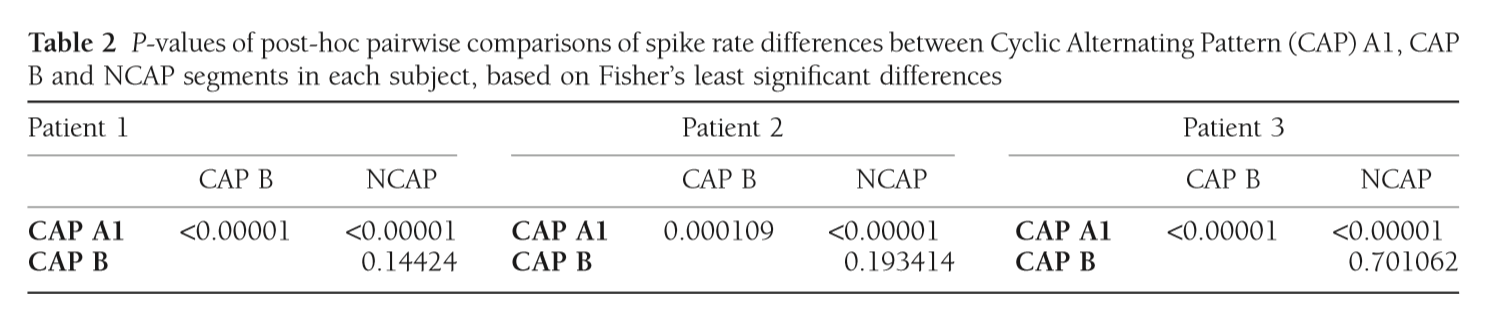
In all three subjects CAP A1 phases were characterized by a significantly higher spike rate than either CAP B or NCAP. Differences between CAP B and NCAP spike rates were not significant in any subject (see Table 2. for details). See Figure 1 for an illustration of spike rate differences across CAP types and NCAP. In both subjects with a sufficiently high number of CAP A1 phases, EEG power spectral density in the delta range showed consistent, significant positive correlation with spike rate during CAP A1 phases. This relationship was, however, not statistically significant in Patient 1 and not present in Patient 2 in CAP B, and completely absent in NCAP periods in both patients (Fig. 2). Furthermore, a positive relationship between spike rate and EEG spectral power in higher (theta and alpha, but not beta) frequency ranges was seen during CAP A1 phases.
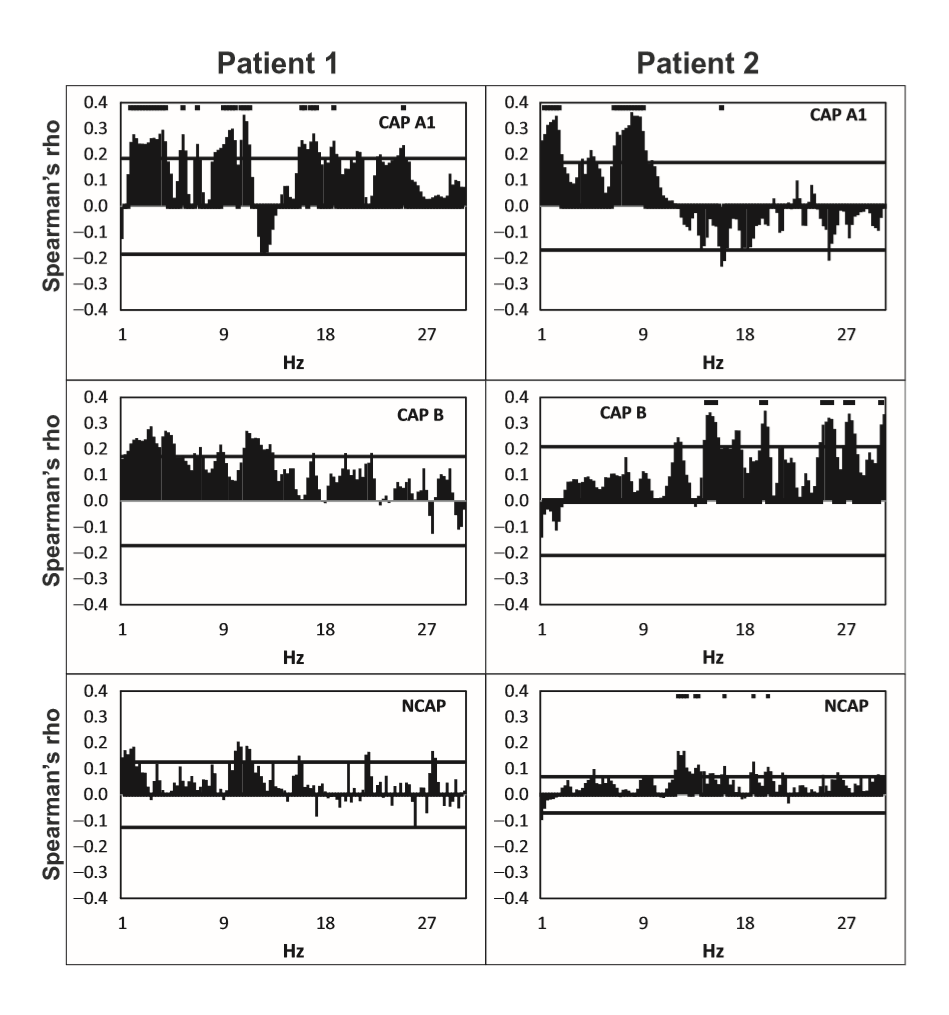
Figure 2 Spearman’s correlation coefficients (axis Y) between spike rate and scalp electroencephalogram (EEG) power at 0.25 Hz frequency bins (axis X) in Cyclic Alternating Pattern [CAP] A1 (top row panels), CAP B (middle row panels), and NCAP (bottom row panels) events in Patients 1 (left column) and 2 (right column). Horizontal lines represent critical correlation coefficients (P = 0.05). A marker above the data is present if Spearman’s correlation coefficient at the given frequency is significant after multiple testing correction.
Discussion
While there is plenty of evidence regarding the reactive nature of at least part of the slow wave activity in CAP,11–14 the role of CAP sequences in the modulation of epileptiform phenomena4,15–20,22 as well as differences between NCAP and CAP slow wave activity,10,26,27 little is known about possible functional differences between ordinary and transient (reactive) slow waves. Our study demonstrates that the epileptiform activity promoting the effect of slow waves is different during NCAP and CAP events. The main result of this study is the correlation of spike rate with the EEG power in the low-frequency band in CAP A1. Spike rate was not only higher during CAP A1 phases than in CAP B or NCAP events, but it was positively correlated with low-frequency EEG power even within CAP A1 phases. For several reasons, it is unlikely that this correlation is an artifact resulting from the spectral composition of spikes themselves. First, spikes were seldom visible on scalp electrodes (generally consisting of a few spikes per minute), in contrast to the 12–26% average spike rate seen even in the least active CAP types (Fig. 1). Second, while spikes contain a wide scale of spectral components including low frequencies, they are mainly composed of high-frequency components (beta) with which no correlation was consistently seen. Third, the correlation with lowfrequency activity was only seen in CAP A1 and not in NCAP. While spike rates were lower during NCAP, allowing for less potential contamination of scalp EEG by spike-related activity, the higher number of NCAP events should compensate for this difference. Therefore, low-frequency spectral changes of scalp EEG as a function of spike activity are unlikely to reflect spikes themselves. Our results suggest that transient bursts of slow wave activity in NREM sleep play an important role in the timing of interictal spikes in epileptic patients. CAP B patterns and especially NCAP NREM sleep contain prominent low-frequency activity; however, this type of activity did not correlate with spiking, which seems to be associated only with slow waves during the CAP A1 pattern. That is, transient (during CAP), but not subcontinuous (during NCAP or B phases) slow activity has an activating effect on epileptoform discharges, supporting a facilitating effect of CAP events on epileptiform discharge rate, as well as a functional dissociation of the slow waves during CAP A patterns and all the other slow waves expressed during CAP B and NCAP periods. This finding coheres with previous reports on increased EEG synchronization episodes associated with CAP A1 subtypes during NREM sleep.10 Thus, the dynamic fluctuation in EEG slow wave synchronization during sleep seems to gate interictal epileptiform EEG phenomena. Significant correlations have emerged between spike rate and a relatively wide frequency range of EEG activity, including (and most prominent within) but not limited to the delta band. This is unsurprising given the fact that CAP A1 patterns are characterized by changes of the EEG power spectral density in a similarly wide range,28 and while delta waves are the most obvious signs of a CAP A1 pattern, other frequencies below the beta range are also present.9,24 Our results suggest that various EEG frequencies are almost equally important for the activating role of CAP on epileptiform discharges. These findings are in line with the instantaneous sleep homeostasis hypothesis of CAP4 and also coherent with the observation that sleep deprivation affects the sleep EEG spectrum in a very similar (1–10 Hz) frequency range:29 a relatively wide range of low-frequency EEG activities appears both as a compensation for lost sleep and as an instantaneous, temporary sleep-enhancing event (CAP A1). The functional importance of such low-frequency activity does not appear to be limited to the delta range. Previous studies about the relationship between sleep microstructure (especially CAP) and epileptiform activity did not include subjects with either temporal lobe epilepsy or epileptic disorders due to cortical dysplasia. Although the number of our patients is low, it is noteworthy that in both categories (mesial temporal lobe epilepsy [MTLE] and cortical dysplasia), findings were congruent with those obtained in other non-lesional epilepsies (with the exception of Rolandic epilepsy), suggesting a common mechanism of CAP modulation of epileptiform activity across several epilepsy types.
Overall, our study confirms previous findings about the preferential occurrence of epileptiform activity during CAP. We also provide evidence that increased epileptiform activity is directly related to low-frequency scalp EEG power during CAP, even within CAP A1 types prominently characterized by such EEG activity. The absence of correlation during NCAP slow-wave periods suggests a functional dissociation between morphologically similar background low-frequency brain activity and transient low-frequency activity of CAP. The scope of our study was limited by the fact that for 2 of 3 patients only frontal scEEG recordings were available. While N2 and SWS as well as CAP A1 phases could be determined based on frontal EEG alone, this is not the case for CAP A2 and A3, which are not characterized by a frontal predominance. Therefore we did not investigate the relationship between EEG spectral power and spike rate in CAP A2 and A3 patterns due to the low number of such events we could detect in our subjects. Given the less prominent presence of slow wave activity in these events a correlation with EEG low frequencies (as seen in A1 phases) is unlikely, but further studies may investigate the correlation between spiking and these events using a more complete scEEG setup. Also, we did not investigate the relationship between spike rate and EEG power below 0.5 Hz, due to the fact that we used 2-s Hanning windows for spectral analysis and the limited ability of conventional scalp EEG to record such low frequencies because of analog amplitude filters and contamination from perspiration artifacts. These low frequency oscillations are a worthy target for future investigations due to their role in grouping higher frequency oscillations.
Supported by OTKA_PD101754, KTIA_NAP_13-12013-0001.
References
1 Pereira AM, Bruni O, Ferri R, Nunes ML. Sleep instability and cognitive status in drug-resistant epilepsies. Sleep Med. 2012; 13: 536–41.
2 Pereira AM, Bruni O, Ferri R, Palmini A, Nunes ML. The impact of epilepsy on sleep architecture during childhood. Epilepsia 2012; 53: 1519–25.
3 Foldvary-Schaefer N, Grigg-Damberger M. Sleep and epilepsy: what we know, don’t know, and need to know. J. Clin. Neurophysiol. 2006; 23 (1): 4–20.
4 Halasz P, Bodizs R. Dynamic Structure of NREM Sleep. Springer: London, 2013.
5 Terzano MG, Mancia D, Salati MR, Costani G, Decembrino A, Parrino L. The cyclic alternating pattern as a physiologic component of normal NREM sleep. Sleep 1985; 8: 137–45.
6 Parrino L, Smerieri A, Spaggiari MC, Terzano MG. Cyclic alternating pattern (CAP) and epilepsy during sleep: how a physiological rhythm modulates a pathological event. Clin. Neurophysiol. 2000; 111: S39–46.
7 Ferri R, Bruni O, Miano S, Terzano MG. Topographic mapping of the spectral components of the cyclic alternating pattern (CAP). Sleep Med. 2005; 6 (1): 29–36.
8 Terzano MG, Parrino L, Smerieri A et al. CAP and arousals are involved in the homeostatic and ultradian sleep processes. J. Sleep Res. 2005; 14: 359–68.
9 Parrino L, Ferri R, Bruni O, Terzano MG. Cyclic alternating pattern (CAP): the marker of sleep instability. Sleep Med. Rev. 2012; 16 (1): 27–45.
10 Ferri R, Rundo F, Bruni O, Terzano MG, Stam CJ. Regional scalp EEG slow-wave synchronization during sleep cyclic alternating pattern A1 subtypes. Neurosci. Lett. 2006; 404: 352–7.
11 Terzano MG, Parrino L, Fioriti G, Orofiamma B, Depoortere H. Modifications of sleep structure induced by increasing levels of acoustic perturbation in normal subjects. Electroencephalogr. Clin. Neurophysiol. 1990; 76 (1): 29–38.
12 Halász P. K-complex, a reactive EEG graphoelement of NREM sleep: an old chap in a new garment. Sleep Med. Rev. 2005; 9: 391–412.
13 Massimini M, Ferrarelli F, Esser SK et al. Triggering sleep slow waves by transcranial magnetic stimulation. Proc. Natl Acad. Sci. U.S.A. 2007; 104: 8496–501.
14 Ferri R, Drago V, Arico D et al. The effects of experimental sleep fragmentation on cognitive processing. Sleep Med. 2010; 11: 378–85.
15 Gigli GL, Calia E, Marciani MG et al. Sleep microstructure and EEG epileptiform activity in patients with juvenile myoclonic epilepsy. Epilepsia 1992; 33: 799– 804.
16 Halasz P, Terzano MG, Parrino L. Spike-wave discharge and the microstructure of sleep-wake continuum in idiopathic generalised epilepsy. Neurophysiol. Clin. 2002; 32 (1): 38–53.
17 Terzano MG, Parrino L, Anelli S, Halasz P, Portera-Sánchez A. Modulation of Generalized spikeand-wave discharges during sleep by cyclic alternating pattern. Epilepsia 1989; 30: 772–81.
18 Bonakis A, Koutroumanidis M. Epileptic discharges and phasic sleep phenomena in patients with juvenile myoclonic epilepsy. Epilepsia 2009; 50: 2434–45.
19 Terzano MG, Parrino L, Garofalo PG, Durisotti C, Filati-Roso C. Activation of partial seizures with motor signs during cyclic alternating pattern in human sleep. Epilepsy Res. 1991; 10 (2-3): 166–73.
20 Parrino L, De Paolis F, Milioli G et al. Distinctive polysomnographic traits in nocturnal frontal lobe epilepsy. Epilepsia 2012; 53: 1178–84.
21 Terzano MG, Parrino L, Spaggiari MC, Barusi R, Simeoni S. Discriminatory effect of cyclic alternating pattern in focal lesional and benign rolandic interictal spikes during sleep. Epilepsia 1991; 32: 616–28.
22 Bruni O, Novelli L, Luchetti A et al. Reduced NREM sleep instability in benign childhood epilepsy with centro-temporal spikes. Clinl Neurophysiol 2010; 121: 665–71.
23 Iber C, Ancoli-Israel S, Chesson A, Quan S. The AASM Manual for the Scoring of Sleep and Associated Events: Rules, Terminology and Technical Specification, 1st edn. American Academy of Sleep Medicine: Westchester, IL, 2007.
24 Terzano MG, Parrino L, Sherieri A et al. Atlas, rules, and recording techniques for the scoring of cyclic alternating pattern (CAP) in human sleep. Sleep Med. 2001; 2: 537– 53. 25 Benjamini Y, Hochberg Y. Controlling the false discovery rate: a practical and powerful approach to multiple testing. J. R. Stat. Soc. Ser. B Stat. Methodol. 1995; 57: 289–300.
26 Ferri R, Parrino L, Smerieri A et al. Non-linear EEG measures during sleep: effects of the different sleep stages and cyclic alternating pattern. Int. J. Psychophysiol. 2002; 43: 273–86.
27 Ferri R, Rundo F, Bruni O, Terzano MG, Stam CJ. Dynamics of the EEG slow-wave synchronization during sleep. Clin. Neurophysiol. 2005; 116: 2783–95.
28 Ferri R, Bruni O, Miano S, Plazzi G, Terzano MG. Allnight EEG power spectral analysis of the cyclic alternating pattern components in young adult subjects. Clin. Neurophysiol. 2005; 116: 2429–40.
29 Borbely AA, Baumann F, Brandeis D, Strauch I, Lehmann D. Sleep deprivation: effect on sleep stages and EEG power density in man. Electroencephalogr. Clin. Neurophysiol. 1981; 51: 483–95.