Journal of Sleep Research (2016) Link
DOI: 10.1111/jsr.12376
Authors:
Péter Simor1,2; Ferenc Gombos3, Sára Szakadát4, Piroska Sándor4, Róbert Bódizs3,4
1 Department of Cognitive Sciences, Budapest University of Technology and Economics,, Budapest, Hungary.
2 Nyírő Gyula Hospital, National Institute of Psychiatry and Addictions, Budapest, Hungary.
3 Department of General Psychology, Pázmány Péter Catholic University, Budapest, Hungary.
4 Institute of Behavioural Sciences, Semmelweis University, Budapest, Hungary.
Corresponding author:
Péter Simor, PhD.
email: psimor@cogsci.bme.hu
Tel: +36 1 463-1273
Fax: +36 1 463-1072
H-1111 Egry József u. 1. Tépület./V.em.
Budapest, Hungary
Péter Simor, Ferenc Gombos, Sára Szakadát, Piroska Sándor and Róbert Bódizs declare no conflict of interest.
P.Simor conceptualized the study design, performed the analyses and wrote the manuscript.
F.Gombos contributed to data analysis and to the writing of the manuscript.
S.Szakadát contributed to sleep staging and elimination of artifacts.
P.Sándor contributed sleep staging and elimination of artifacts.
R.Bódizs contributed to the writing of the manuscript.
Summary
Rapid Eye Movement (REM) sleep is composed of phasic and tonic periods, two distinguishable microstates in terms of arousal thresholds and sensory processing. Background EEG oscillations are also different between periods with (phasic state) and periods without (tonic state) eye movements. In Study 1 we replicated previous findings analyzing EEG spectral power in phasic and tonic REM sleep extending our analyses to the high gamma range (52-90 Hz). In Study 2 we examined phasic and tonic spectral power differences within a group of 4-8 year old children. Based on the polysomnographic data of 20 young adults, the phasic state yielded increased delta and theta power in anterior sites, as well as generally decreased high alpha and beta power in comparison to the tonic state. Moreover, phasic periods exhibited greater spectral power in the lower and the higher gamma band. Interestingly, children (n = 18) exhibited a different pattern, showing increased activity in the low alpha range during phasic periods. Moreover, during phasic in contrast to tonic REM sleep increased low and high gamma and enhanced low gamma band power emerged in anterior and posterior regions, respectively. Our findings show that spectral activity within the high gamma range substantially contribute to the differences between phasic and tonic REM sleep, especially in adults. Moreover, our data underscores the heterogeneity of REM sleep and points to marked differences between young adults and children regarding phasic/tonic EEG spectral power. These results suggest that the differentiation between phasic and tonic REM periods undergoes maturation.
Keywords: sleep, development, polysomnography, arousal, Gamma.
Introduction
Rapid Eye Movement (REM) sleep is characterized by low voltage, mixed frequency electroencephalographic (EEG) activity with a concomitant loss of muscle tone. Phasic activities, such as transient bursts of eye movements, myoclonic twitches, irregular vegetative activity are also characteristic features of this sleep state (Carskadon and Dement, 2000). Phasic and tonic REM periods seem to differ regarding arousal, awakening thresholds and sensory processing, as tonic periods show reduced thresholds in contrast to phasic episodes (Ermis et al., 2010) and infrequent auditory stimuli elicit stronger evoked responses in tonic than in phasic states (Sallinen et al., 1996). Moreover, auditory stimulation elicits residual BOLD activation in the auditory cortex during tonic, but not during phasic REM periods (Wehrle et al., 2007). This finding suggests that phasic REM sleep is “functionally isolated” from environmental stimuli whereas during tonic periods residual alertness is maintained (Wehrle et al., 2007). Accordingly, sustained auditory stimulation suppresses phasic activity (REMs) and facilitate a transition from phasic to tonic state with higher arousal and sensory input (Stuart and Conduit, 2009; Wehrle et al., 2007).
Whereas the heterogeneity of NREM sleep in terms of cortical activity, arousability and sleep stability is well established (Halász et al., 2004; McKinney et al., 2011; Parrino et al., 2012), relatively few studies have contrasted EEG spectral activity during phasic and tonic REM periods. Polysomnographic studies on healthy adults have found increased alpha and beta as well as decreased delta and theta power during tonic in contrast to phasic REM sleep (Jouny et al., 2000; Waterman et al., 1993). Moreover, phasic REM sleep exhibited relatively increased activity in the gamma (>30 Hz) frequency range as evidenced by scalp EEG (Jouny et al., 2000), intracranial recording (Gross and Gotman, 1999) and animal studies (Brankačk et al., 2012). Higher alpha and beta power during tonic periods might reflect increased arousal (and environmental awareness), whereas gamma power predominating during phasic periods has been interpreted as an indicator of enhanced “internally driven” cognitive activity (Gross and Gotman, 1999; Llinás and Ribary, 1993). Nevertheless, the above studies included very small sample sizes. Furthermore, the gamma band was traditionally analyzed between 30-48 Hz, however, studies indicate that gamma activity during phasic REM sleep might encompass a broader frequency range (extending to ~100 Hz) (Brankačk et al., 2012).
In our first study we aimed to replicate these findings with a relatively larger sample size analyzing EEG spectral power in phasic and tonic REM sleep and extending our analyses to the high gamma (52-90 Hz) band. Given that EEG differences between REM microstates have only been investigated in adults, we conducted a second, similar study with children. Although this study was mainly exploratory in nature, we hypothesized that due to the less differentiated characteristics of sleep microstates (Grigg-Damberger et al., 2007) and generally lower arousability during sleep (Carskadon and Dement, 2000), children would not exhibit a relative increase of alpha and beta band power during tonic states.
Study 1
Participants and procedure
Twenty healthy university students (10 males, Mage = 21.72 ± 1.36) recruited from three different Hungarian universities participated for partial course credits in the experiment. Participants reported no prior or current neurological, psychiatric or sleep disorders or any kind of chronic disease and showed no signs of anxiety or depression based on standard psychometric measurements. They spent two consecutive nights in the sleep laboratory of Semmelweis University with standard polysomnography recording. The first night served as an adaptation night, and the recordings of the second night were used for subsequent analyses. Participants were not allowed to drink alcohol or take drugs (except contraceptives) on the day and the previous day of the examination. They were asked to avoid napping and consuming caffeine on the afternoon of the measurements. Participants were instructed to go to bed at their preferred and habitual bedtime. Lights-off were timed between 11.00 PM and 1.00 AM. Morning awakenings were scheduled after nine hours of undisturbed sleep unless participants woke up earlier spontaneously. The study protocol was approved by the Ethical Committee of the Semmelweis University, and written informed consent was obtained.
EEG recordings and data pre-processing
On both nights, participants were fitted with scalp electrodes according to the placement of the 10-20 system (Jasper, 1958) as well as with bipolar EOG and chin EMG (bipolar channels) electrodes. Gold-coated Ag/AgCl EEG cup electrodes were fixed with EC2 Grass Electrode Cream (Grass Technologies, USA) and the EEG derivations F3, F4, C3, C4, P3, P4, O1 and O2 were referred to the mathematically-linked mastoids. Impedances were kept always below 8 kΩ. Signals were collected, pre-filtered (0.33–1500 Hz, 40dB/decade anti-aliasing hardware input filter), amplified and digitized with 4096 Hz/channel sampling rate (synchronous) with 12 bit resolution by using the 32 channel EEG/polysystem (Brain-Quick BQ 132S, Micromed, Italy). A further 40 dB/decade anti-aliasing digital filter was applied by digital signal processing which low-pass filtered the data at 450 Hz. Finally, the digitized and filtered EEG was downsampled to 1024 Hz. Sleep stages were scored in 20 s epochs according to standardized criteria (Iber et al., 2007). All epochs were divided to 4 s long segments, and all segments containing technical or movement-related artifacts (including transient arousals with muscle activity) were visually inspected and excluded from subsequent analyses.
REM periods from the first four sleep cycles were considered for the selection of phasic and tonic segments. Phasic and tonic segments were scored manually by a trained researcher who was blind to the purpose of the study. Rapid Eye Movements were visually identified in 2 s time windows based on the presence of EOG deflections shorter than 400 ms and above 150mV (Tan et al., 2001). A 4 s long segment was considered as phasic if at least two consecutive REMs were detected in adjacent 2 s time windows. Segments were defined as tonic when no eye movements occurred (EOG deflections below 25mV) in adjacent 2 s windows. Although these criteria were relatively conservative for the selection of phasic and tonic segments, in order to rule out possible intermediate periods and the contamination between the two states, in the final analyses only those phasic and tonic segments were included that were separated from each other by at least two segments (8 seconds). Given the larger amount of tonic as opposed to phasic periods, 100 phasic and 100 tonic segments (400 s) were randomly selected per each participant.
Spectral power analyses
Average spectral power densities were calculated for phasic and tonic segments separately. Selected segments in each EEG derivation (F3, F4, C3, C4, P3, P4, O1, O2) and in the EMG channel were Hanning-tapered and Fourier transformed by the FFT algorithm (Fast Fourier Transformation with 50% overlapping windows). Absolute power was calculated with mV2/0.25 Hz bin resolution and the values for the specific bins were summed up to obtain the EEG frequency bands of interest. To minimize the effect of ocular artifacts on the lowest frequency range, the delta band was defined between 2-4 Hz because the spectral power of eye movement potentials occupies predominantly the 0.3-2 Hz frequency range (Tan et al., 2001). The remaining bands included the traditional frequency domains (Theta: 4-8 Hz, Alpha1: 8-11 Hz, Alpha2: 11-14.5 Hz, Beta: 14.5-31 Hz, Gamma: 31-48 Hz) including the high gamma (Gamma2: 52-90 Hz) band. Activity between 48-52 Hz was not included in the analyses due to the influence of external noise in this frequency range. Spectral power in anterior (F3, F4, C3, C4) and posterior (P3, P4, O1, O2) regions were averaged to reduce the number of statistical comparisons and averaged values were log-transformed (log10) to normalize their distribution. Spectral power values of the EMG channel were averaged between 60-200 Hz and used as an index of background EMG activity (Pivik et al., 1993). Additionally, the phasic to tonic ratio of spectral EMG power was computed in order to include it as a covariate in subsequent analyses.
Statistical analyses
Statistical analyses were carried out with R (Team, 2012). The normality assumption was verified by the Shapiro-Wilk test as well as the skewness and kurtosis of power spectral values within each frequency band, region (anterior and posterior) and condition (phasic and tonic). A repeated measures 2 x 14 Analyses of Variance (ANOVA) with Condition (phasic/tonic) and EEG bands (all frequency bands in anterior and posterior derivations) as within-subject factors accounted for a “full” model. Greenhouse-Geisser correction was applied to compensate for the violation of sphericity. The level of significance was set at p < 0.05. Additionally, paired sample t-tests were performed to contrast frequency band power values between phasic and tonic conditions in anterior and posterior locations. In order to rule out the possible influence of background EMG activity on EEG power differences, we performed multiple (fourteen) repeated measures univariate Analyses of Covariance (ANCOVA) for each frequency band and region separately with Condition (phasic/tonic) as a within-subject factor and EMG phasic/tonic ratio as covariate in the models. The issue of multiple comparisons was addressed by False Discovery Rate (FDR) correction (Benjamini et al., 2001).
Results
Spectral power values of all frequency domains as well as the phasic/tonic EMG power ratio were normally distributed (all p > 0.05) according to the Shapiro-Wilk test. The skewness (between -0.6 and 1.1) and the kurtosis (between -1.5 and 1.5) also indicated that data did not deviate from normality. The full model has shown a non-significant main effect of Condition (F1,19 = 0.16, p = 0.63) and a significant main effect of EEG bands (F4.16,79.04 = 631.9, p = 2-16). Furthermore, a significant interaction of Condition x EEG bands has emerged (F3.06,58.04 = 9.9, p = 2-16) that accounted for more than 30 percent of the variance (Partial η2 = 0.34). Paired sample t-tests indicated (Table 1) that phasic and tonic REM segments were different regarding several frequency domains. The phasic condition was characterized by higher values of delta and theta power, specifically at the anterior region and increased gamma power (gamma1 and gamma2) at anterior and posterior regions. In contrast, greater high alpha (alpha2) and beta activity emerged during the tonic state in both anterior and posterior regions. Interestingly, the consensus-based boundaries of the examined frequency bands clearly differentiated phasic and tonic periods: the phasic state showed greater activity in slow (2-8 Hz) and fast (32-90 Hz) oscillations, whereas the tonic phase was characterized by higher oscillatory activity comprising the alpha and beta range (~10-30 Hz) (see Figure 1). Nevertheless, differences in slow oscillations (delta and theta power) were statistically significant only in the anterior region (Figure 2). To control for the confounding effects of background EMG activity, paired comparisons of all the outcome variables (spectral power values in each frequency domain at anterior and posterior regions) between phasic and tonic conditions were performed with univariate ANCOVAs including phasic/tonic EMG power ratio as covariate in the model. Based on these analyses, differences in phasic and tonic EMG activity did not modify our main results (see Table 3 in supplementary data).
Table 1. Paired sample t-tests contrasting frequency band power values of phasic and tonic REM sleep in anterior and posterior regions in a group (n = 20) of young adults.
|
Dependent Variables |
T value
|
Confidence Interval |
P value (FDR adjusted) |
Effect Size (Cohen D) |
Phasic vs. Tonic |
|
Anterior Sites |
|||||
|
Delta |
3.32 |
[0.03 – 0.11] |
0.007 |
0.74 |
PH > T |
|
Theta |
2.51 |
[0.01 – 0.09] |
0.03 |
0.56 |
PH > T |
|
Alpha1 |
0.02 |
[-0.04 – 0.04] |
0.98 |
0.01 |
PH ≈ T |
|
Alpha2 |
-3.36 |
[-0.11 – -0.02] |
0.007 |
0.75 |
PH < T |
|
Beta |
-4.65 |
[-0.1 – -0.04] |
0.001 |
1.04 |
PH < T |
|
Gamma1 |
2.83 |
[0.009 – 0.06] |
0.02 |
0.63 |
PH > T |
|
Gamma2 |
4.97 |
[0.06 – 0.15] |
0.001 |
1.11 |
PH > T |
|
Posterior Sites |
|||||
|
Delta |
1.5 |
[-0.09 – 0.06] |
0.17 |
0.33 |
PH ≈ T |
|
Theta |
-0.6 |
[ -0.03 – 0.01 ] |
0.59 |
0.13 |
PH ≈ T |
|
Alpha1 |
-1.7 |
[-0.17 – 0.01] |
0.13 |
0.38 |
PH ≈ T |
|
Alpha2 |
-3.39 |
[-0.11 – -0.03] |
0.007 |
0.76 |
PH < T |
|
Beta |
-3.56 |
[-0.08 – -0.02] |
0.007 |
0.8 |
PH < T |
|
Gamma1 |
2.6 |
[-0.006 – 0.05] |
0.03 |
0.58 |
PH > T |
|
Gamma2 |
3.74 |
[0.04 – 0.13] |
0.006 |
0.84 |
PH > T |
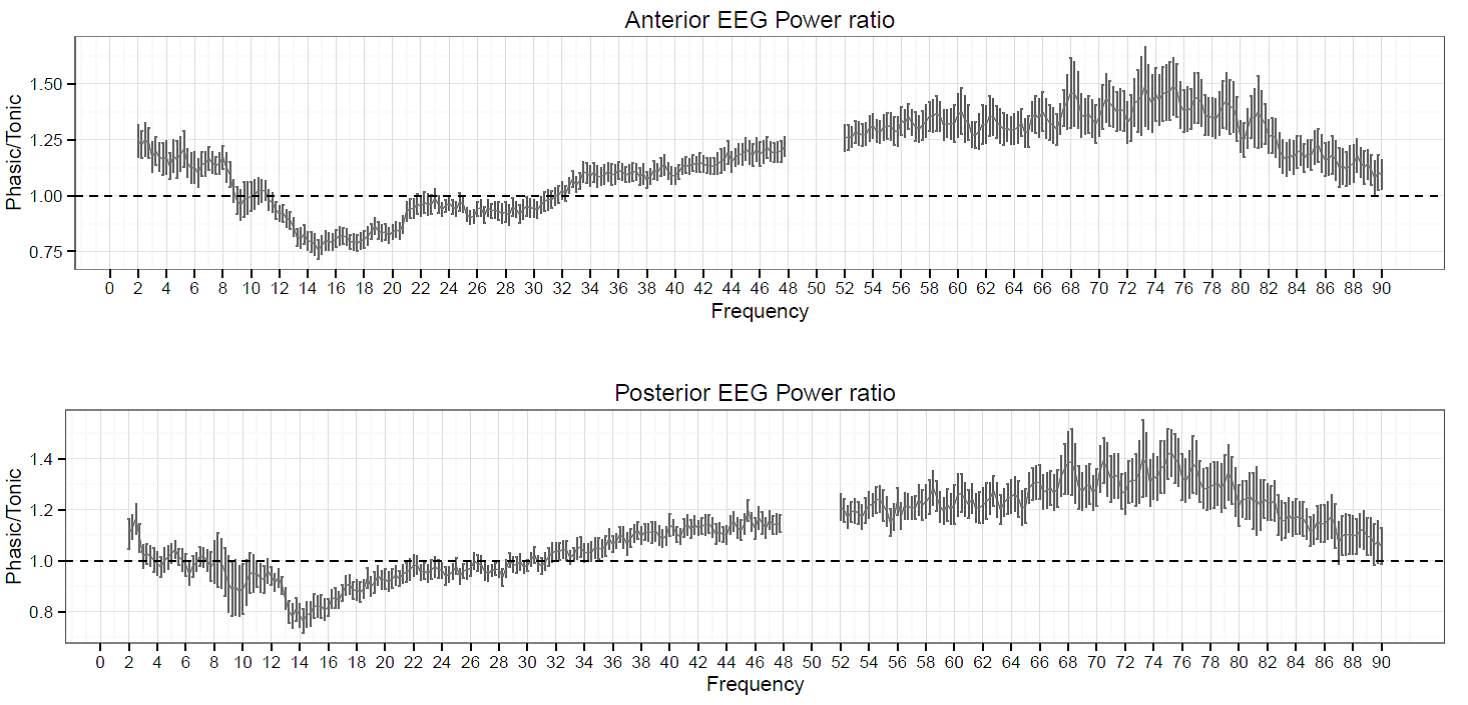
Figure 1. The ratio of phasic/tonic EEG spectral power averaged across anterior and posterior derivations as a function of frequency bins between 2-90 Hz in young adults. Values between 48-52 were not included due to potential artifacts caused by electrical power lines.
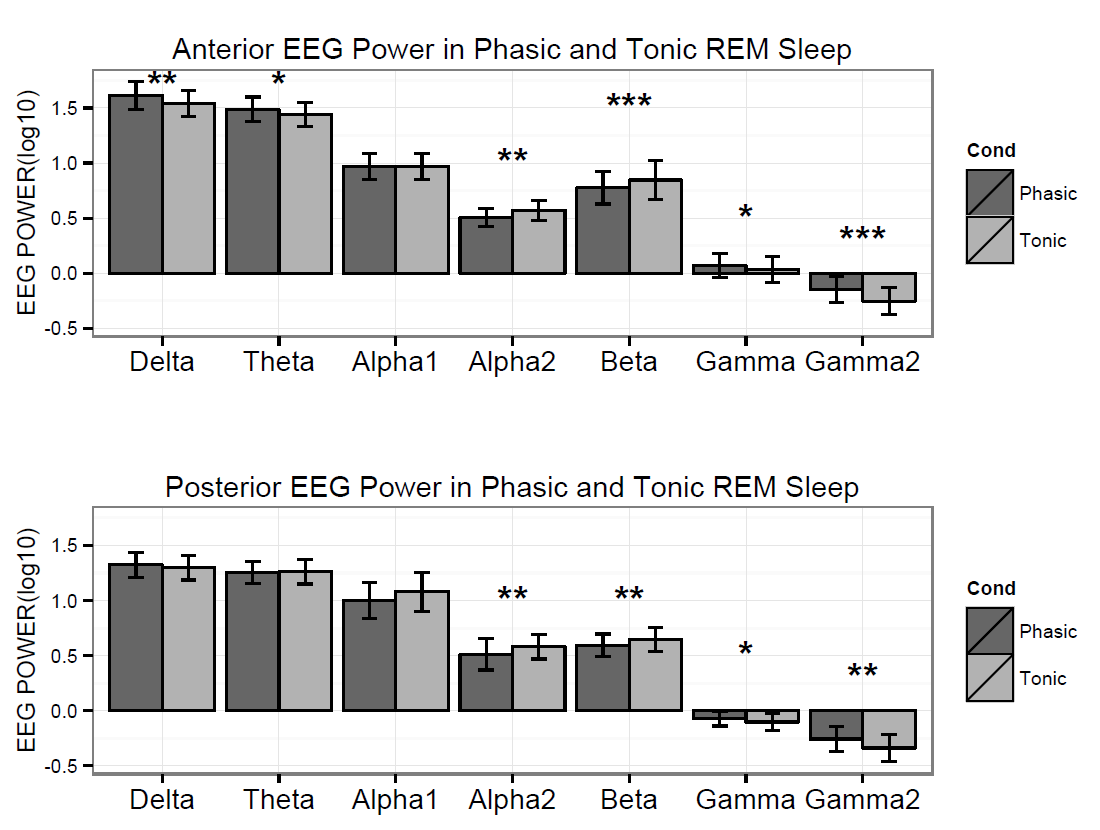
Figure 2. Logarithmized (log10) absolute spectral power values in phasic and tonic states for different frequency bands in young adults.
STUDY2
Participants and procedure
We examined the polysomnographic data of the second nights’ recordings of 25 pre-school and school-aged children. The data of five children were excluded due to low number of phasic periods. Additionally, the data of two children were excluded because of increased muscle artifacts. Finally, the recordings of 18 children (9 males, Mage = 6.7 ± 1.41) were analyzed. Children were recruited from the greater Budapest area by adverts for parents and word of mouth. Children were free of any current or prior diagnosis of mental or somatic illness or sleep complaints (based on parents’ reports). They have spent two consecutive nights in the sleep laboratory of the Semmelweis University. The first night served as an adaptation night, and the recordings of the second night were used for subsequent analyses. The parents (usually the mother) of the children were sleeping in the same room in an adjacent bed. Lights off was scheduled between 9.00 and 11.00 PM following habitual bedtimes. Morning awakenings were scheduled after ten hours of undisturbed sleep unless children woke up earlier spontaneously. The study protocol was approved by the Ethical Committee of the Semmelweis University, and written informed consent was obtained.
Data analyses
EEG data acquisition, data pre-processing, spectral power and statistical analyses were equivalent to the procedure described in STUDY 1.
Results
Based on the Shapiro-Wilk test (all p > 0.05) as well as the skewness (between -0.5 and 1.3) and kurtosis (between -1.5 and 1.8) values, the outcome variables did not deviate from normality. The full model yielded a significant main effect of Condition (F1,17 = 8.26, p = 0.01) and EEG bands (F3.64, 64.88 = 247.1, p =2-16). Moreover, the interaction term between Condition and EEG bands was also significant (F4.55, 77.35 = 6.51, p =2-10) and explained 30 percent of the variance (Partial η2 = 0.3). Parsing out this interaction by paired sample t-tests revealed significantly higher spectral power values within the alpha1 frequency band in anterior and posterior regions during the phasic state in contrast to the tonic period. Effect sizes indicated that the relative enhancement of alpha1 power was more pronounced in the posterior region. Additionally, during phasic in contrast to tonic REM sleep increased gamma1 and gamma2 and enhanced gamma1 band power emerged in anterior and posterior regions, respectively (see Table 2 and Figure 3 for details). Bin-wise visualization of the contrast between phasic and tonic spectral power values within the examined 2-90 Hz frequency range indicated relatively increased activity between 7-12 Hz (peaking around 8 Hz), 20-38 Hz (peaking around 31 Hz) and 52-82 Hz (peaking around 70 Hz) during the phasic state (see Figure 4). Frequency band-wise statistical differences between phasic and tonic conditions remained significant after the inclusion of phasic/tonic EMG spectral power as covariate in the univariate ANCOVAs (see Table 4 in supplementary data).
Table 2. Paired sample t-tests contrasting frequency band power values of phasic and tonic REM sleep in anterior and posterior regions in a group (n = 18) of children.
|
Dependent Variables |
T value
|
Confidence Interval |
P value (FDR adjusted) |
Effect Size (Cohen D) |
Phasic vs. Tonic |
|
Anterior Sites |
|||||
|
Delta |
0.25
|
[-0.04 – 0.05] |
0.8 |
0.05 |
PH ≈ T |
|
Theta |
-0.81 |
[-0.06 – 0.02] |
0.46 |
0.19 |
PH ≈ T |
|
Alpha1 |
4.56 |
[0.04 – 0.12] |
0.001 |
1.07 |
PH > T |
|
Alpha2 |
-0.81
|
[-0.06 – 0.03] |
0.46 |
0.18 |
PH ≈ T |
|
Beta |
1.69
|
[-0.00 – 0.03] |
0.2 |
0.39 |
PH ≈ T |
|
Gamma1 |
3.7 |
[0.02 – 0.09] |
0.008 |
0.87 |
PH > T |
|
Gamma2 |
3.13 |
[0.01 – 0.09] |
0.02 |
0.74 |
PH > T |
|
Posterior Sites |
|||||
|
Delta |
0.97 |
[-0.02 – 0.05] |
0.46 |
0.22 |
PH ≈ T |
|
Theta |
0.91 |
[-0.02 – 0.04] |
0.46 |
0.21 |
PH ≈ T |
|
Alpha1 |
7.86 |
[0.08 – 0.14] |
0.00001 |
1.85 |
PH > T |
|
Alpha2 |
1.0 |
[-0.01 – 0.03] |
0.46 |
0.23 |
PH ≈ T |
|
Beta |
2.42 |
[0.00 – 0.04] |
0.06 |
0.57 |
PH ≈ T |
|
Gamma1 |
2.71 |
[0.01 – 0.07] |
0.04 |
0.64 |
PH > T |
|
Gamma2 |
1.66 |
[0.01 – 0.07] |
0.2 |
0.39 |
PH ≈ T |
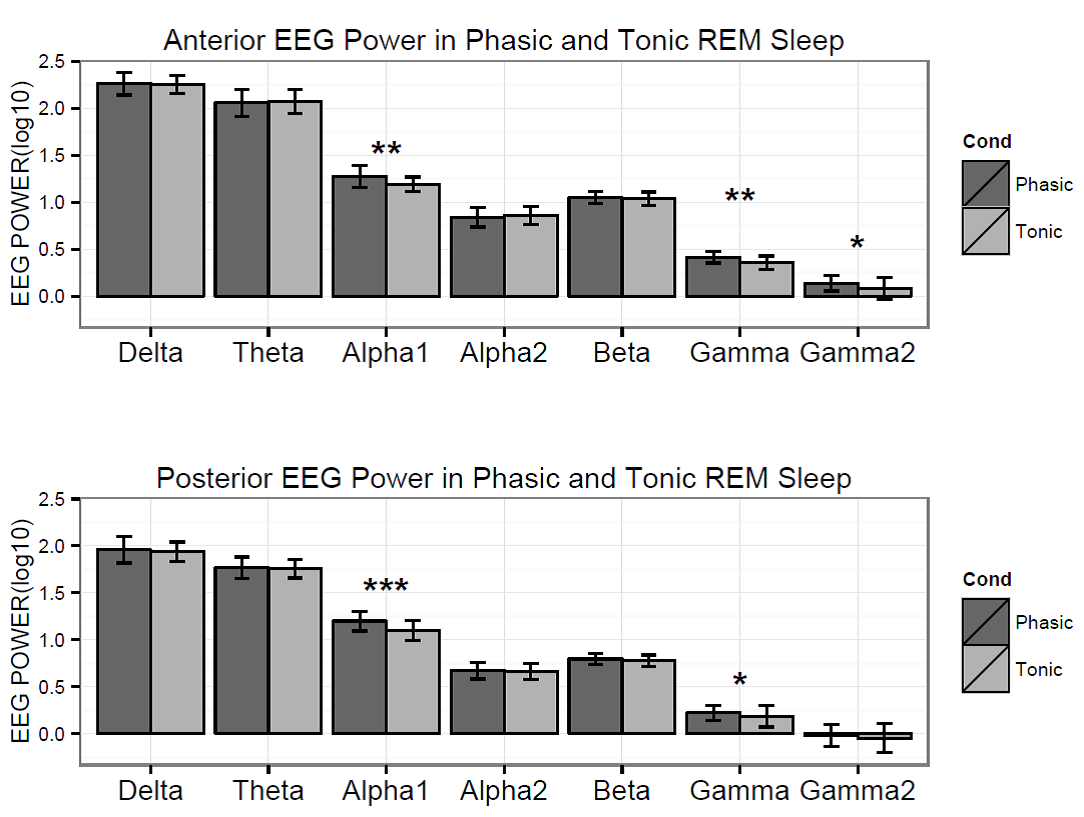
Figure 3. Logarithmized (log10) absolute spectral power values in phasic and tonic states for different frequency bands in children.
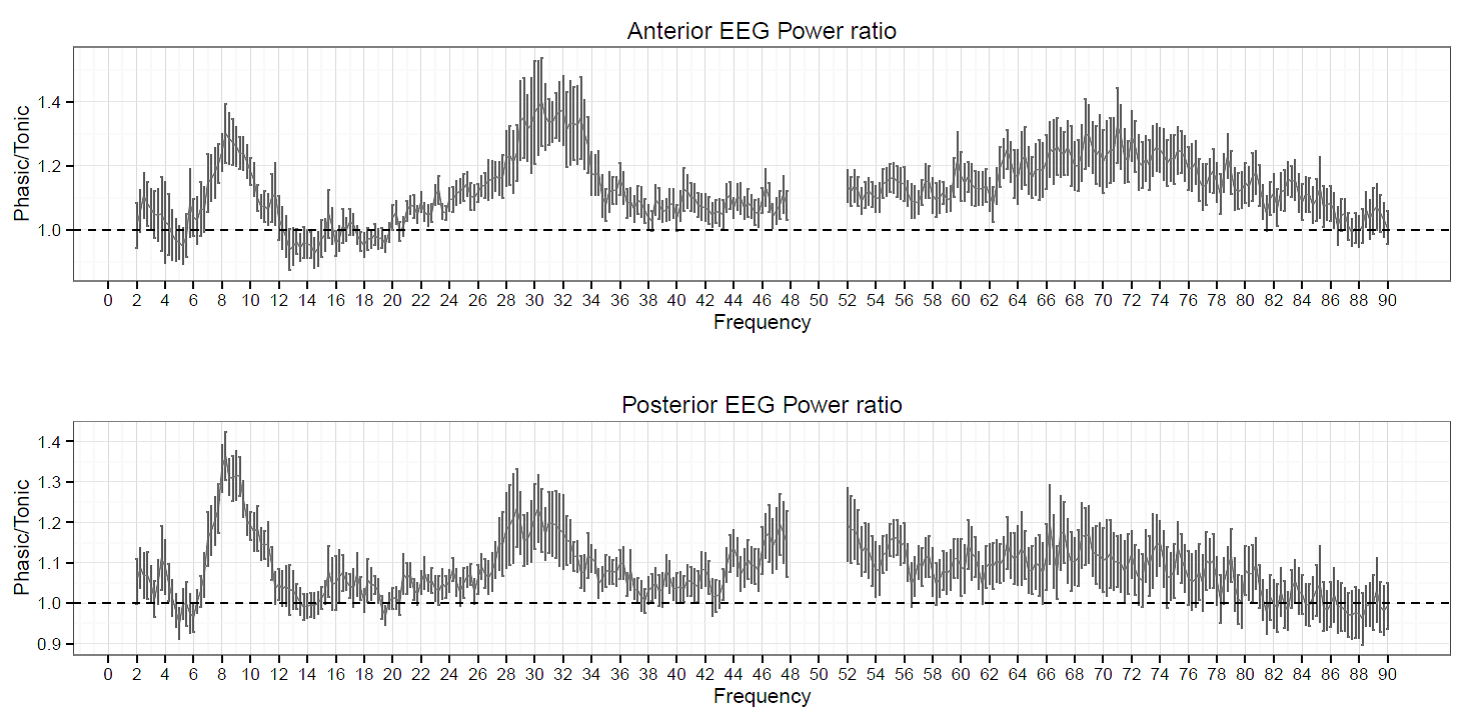
Figure 4. The ratio of phasic/tonic EEG spectral power averaged across anterior and posterior derivations as a function of frequency bins between 2-90 Hz in children. Values between 48-52 were not included due to potential artifacts caused by electrical power lines.
Discussion
The aim of our first study was to examine power spectral activity during phasic and tonic REM sleep in a group of young adults. Phasic REM sleep was characterized by relatively increased delta and theta power in anterior sites, as well as generally decreased alpha2 and beta power in comparison to the tonic state. Moreover, phasic periods exhibited greater spectral power in the lower as well as the higher gamma band.
The above pattern is in line with previous scalp EEG studies that have contrasted phasic and tonic REM sleep (Jouny et al., 2000; Waterman et al., 1993). As these authors also accentuate, fronto-central increases in slow oscillations might result from ocular movements during phasic periods. Since rapid eye movement potentials are not manifested above 2 Hz (Tan et al., 2001), spectral power values below this frequency range were excluded from our analyses; however, delta and theta power increases in phasic periods still might be related to the potentials generated by eye movements. The lack of delta and theta power increments in the posterior region supports this assumption, since ocular contamination is negligible in posterior leads (Waterman et al., 1992). Increased spectral power in the high alpha and beta range during the tonic state as well as greater gamma activity during phasic periods was also reported in earlier scalp EEG (Abe et al., 2008; Jouny et al., 2000; Waterman et al., 1993) and intracranial assessments (Gross and Gotman, 1999).
In coherence with previous data, these findings indicate that REM sleep is far from being a homogeneous sleep stage, exhibiting (at least) two markedly different states in terms of neural oscillations. Higher arousability and awakening thresholds (Ermis et al., 2010), increased sensory processing (Sallinen et al., 1996; Wehrle et al., 2007) as well as background EEG activity in the alpha and beta range suggests that tonic REM is a more “wake-like” state with increased environmental processing. In contrast, phasic REM periods might reflect a relative “detachment” of the environment characterized by inwardly directed emotional and cognitive processes (Wehrle et al., 2007). Some authors speculated that the relative shift from alpha and beta to faster EEG oscillations including the high gamma range during phasic REM sleep might reflect increased cognitive processes as well as an enhancement in the level of consciousness (Gross and Gotman, 1999; Llinás and Ribary, 1993).
The interplay between sleep-like and wake-like oscillations driven by homeostatic pressure and the demands of environmental processing are well described in case of NREM sleep (Halász et al., 2004; McKinney et al., 2011; Parrino et al., 2012). The quasi-periodic appearance (Drucker-Colin et al., 1977) and the sleep-dependent modulation of eye movements (Khalsa et al., 2002) within REM sleep might also suggest that the dynamic of REM sleep is also governed by the influence of different (presumably) homeostatic and alerting mechanisms. Interestingly, bin-wise examination of spectral power in phasic and tonic REM sleep showed that these two states are clearly distinguishable by the consensual boundaries of frequency domains. Our findings indicate that enhanced gamma oscillations during phasic periods move beyond the traditionally defined gamma band (31-48 Hz) including even faster frequencies (until ~90 Hz). Furthermore, the phasic to tonic difference regarding gamma oscillations was more pronounced (based on the effect size) in the faster gamma range peaking around 75 Hz. This finding indicates that activity within the high gamma range substantially contribute to phasic/tonic differences in young adults. To the best of our knowledge no previous studies contrasted phasic and tonic REM sleep examining high gamma activity recorded by scalp EEG. Our findings suggest that further studies measuring spectral power in REM sleep (in different populations) might extend their analyses to the high gamma range.
In sum, our data on healthy adults indicate that phasic and tonic states are characterized by different background EEG activity: increased high alpha and beta power during tonic, and enhanced (broad-band) gamma activity during phasic REM sleep.
According to our second study, phasic and tonic spectral power differences seem to show a markedly different pattern in children. First of all, the tonic state was not characterized by higher alpha2 and beta activity in comparison to the phasic state. Additionally, although gamma power was relatively increased during the phasic state (resembling the findings in adults), this enhancement was more pronounced in the lower gamma range, peaking around 31 Hz (see Figure 4 and effect sizes of Table 2). And finally, children exhibited relatively increased alpha1 power within phasic REM sleep that was more pronounced in the posterior region.
These patterns are hard to interpret given the lack of studies regarding the neurophysiological features of REM sleep in children. Nevertheless, our data indicates that the differentiation between phasic and tonic REM sleep states undergoes maturation. While adults exhibit increased arousals and lowered awakening thresholds during tonic periods, children are characterized by generally and perhaps state-independently higher arousal thresholds (Busby et al., 1994), higher homeostatic sleep pressure and amounts of slow-oscillations during sleep (Carskadon and Dement, 2000; Feinberg and Campbell, 2010; Kurth et al., 2010) that might extend to REM sleep as well. We might speculate that wake-like (high alpha and beta) oscillations in relation to increased environmental processing are minimized due to increased homeostatic sleep pressure and therefore are not manifested during tonic states in children.
The relatively lower peak frequency of gamma power enhancement during the phasic state is consistent with earlier studies showing that resting-state gamma band oscillations increase during development in parallel with the gradual maturation of perceptual and cognitive capacities (Uhlhaas et al., 2010). In addition, gamma frequency was shown to be modulated by the level of arousal (Lakatos et al., 2004), and the latter might be lower in children as compared to adults. Since phasic REM might involve periods with intense perceptual and cognitive processes (Hobson et al., 2014) the specific pattern of gamma oscillations could also reflect a process of ongoing cortical maturation indicating that similar cortical processes might operate during waking and REM sleep.
In contrast to the findings in adults phasic periods of REM sleep were characterized by increased alpha (7-12 Hz) power in children. There is no unequivocal explanation for this discrepancy between the age groups. The posterior location of the alpha waves are similar to the topography of alpha-gamma cross-frequency coupling during rest (Osipova et al., 2008). Although we did not test cross-frequency coupling in our study, the finding that alpha power correlates positively with alpha-gamma coupling during rest in adults is indicative for similar processes in children’s phasic REM sleep. In order to elucidate the possible maturational aspects of this phasic REM sleep alpha-gamma co-activation further studies with broader age range are needed.
Among the limitations of our study, we should note that due to the small number of electrodes we could not examine fine-grained oscillatory activity and therefore, our inferences about the functional differences between phasic and tonic states remain mainly speculative. Moreover, due to the low number of electrode sites differences between anterior and posterior regions remain to be mainly illustrative lacking sufficient explanatory power. Scalp EEG recordings might also be biased by background muscular activity. Since these artifacts mainly affect a broad EEG frequency range (~45-200 Hz), a widely applied procedure is to residualize EEG band power values with a predefined EMG index based on high frequency EEG spectral power (Pivik et al., 1993). Nevertheless, this approach was not suitable for our analyses that focused on high frequency EEG activities, therefore we used chin EMG spectral power values as covariates in our model. Although chin EMG activity might only be a rough estimate of background muscle activity present in the scalp, it seems unlikely that our findings regarding phasic and tonic spectral power differences are due to muscular artifacts. Firstly, muscle activity within REM sleep was reported to be evenly distributed (Brunner et al., 1996); our findings resemble of those studies with intracortical recordings, where muscle activity is minimal; and spectral differences between phasic and tonic periods were limited to narrower frequency bands with clear peak frequencies in contrast to muscle activity that generally affects a broader bandwith (Pivik et al., 1993). Nevertheless, our results still need to be treated with caution and further studies with more surface EMG derivations (measuring activity of several head muscles) might validate our findings.
In spite of these shortcomings, our data accentuates the heterogeneity of REM sleep separating phasic and tonic periods in terms of spectral power differences including the high gamma frequency range. Moreover, our study is the first to examine phasic/tonic spectral power differences in a group of children. And finally, our findings suggest that the differentiation between phasic and tonic REM periods might follow a maturational trajectory.
Acknowledgments
The authors thank Klára Horváth for her valuable comments on the manuscript.
This research was supported by the European Union and the State of Hungary, co-financed by the European Social Fund in the framework of TÁMOP 4.2.4. A/-11-1-2012-0001 ‘National Excellence Program’. Péter Simor was supported by the János Bolyai Research Scholarship of the Hungarian Academy of Sciences.
References
Abe, T., Matsuoka, T., Ogawa, K., Nittono, H., Hori, T. Gamma band EEG activity is enhanced after the occurrence of rapid eye movement during human REM sleep. Sleep Biol. Rhythms., 2008, 6: 26–33.
Benjamini, Y., Drai, D., Elmer, G., Kafkafi, N., Golani, I. Controlling the false discovery rate in behavior genetics research. Behav. Brain Res., 2001, 125: 279–284.
Brankačk, J., Scheffzük, C., Kukushka, V.I., Vyssotski, A.L., Tort, A.B.L., Draguhn, A. Distinct features of fast oscillations in phasic and tonic rapid eye movement sleep. J. Sleep Res., 2012, 21: 630–633.
Brunner, D., Vasko, R., Detka, C., Monahan, J., Reynolds Iii, C., Kupfer, D. Muscle artifacts in the sleep EEG: Automated detection and effect on all-night EEG power spectra. J. Sleep Res., 1996, 5: 155–164.
Busby, K.A., Mercier, L., Pivik, R.T. Ontogenetic variations in auditory arousal threshold during sleep. Psychophysiology, 1994, 31: 182–188.
Carskadon, M.A., Dement, W.C. Normal human sleep: an overview. Princ. Pract. Sleep Med., 2000, 2: 16–25.
Drucker-Colin, R.R., Bernal-Pedraza, J.G., Díaz-Mitoma, F.J., Zamora-Quezada, J. Oscillatory changes in multiple unit activity during rapid eye movement sleep. Exp. Neurol., 1977, 57: 331–341.
Ermis, U., Krakow, K., Voss, U. Arousal thresholds during human tonic and phasic REM sleep. J. Sleep Res., 2010, 19: 400–406.
Feinberg, I., Campbell, I.G. Sleep EEG changes during adolescence: an index of a fundamental brain reorganization. Brain Cogn., 2010, 72: 56–65.
Grigg-Damberger, M., Gozal, D., Marcus, C.L., Quan, S.F., Rosen, C.L., Chervin, R.D., Wise, M., Picchietti, D.L., Sheldon, S.H., Iber, C. The visual scoring of sleep and arousal in infants and children. J. Clin. Sleep Med., 2007, 3: 201–240.
Gross, D.W., Gotman, J. Correlation of high-frequency oscillations with the sleep-wake cycle and cognitive activity in humans. Neuroscience, 1999, 94: 1005–1018.
Halász, P., Terzano, M., Parrino, L., Bódizs, R. The nature of arousal in sleep. J. Sleep Res., 2004, 13: 1–23.
Hobson, J.A., Hong, C.C.-H., Friston, K.J. Virtual reality and consciousness inference in dreaming. Front. Psychol., 2014, 5: 1133.
Iber, C. The American Academy of Sleep Medicine Manual for thescoring of sleep and associated events: rules, terminology and technical specification. Darien, IL: American Academy of Sleep Medicine. 2007.
Jasper, H. Report of the committee on methods of clinical examination in electroencephalography. Electroencephalogr. Clin. Neurophysiol., 1958, 10: 370–375.
Jouny, C., Chapotot, F., Merica, H. EEG spectral activity during paradoxical sleep: further evidence for cognitive processing. Neuroreport, 2000, 11: 3667–3671.
Khalsa, S.B.S., Conroy, D.A., Duffy, J.F., Czeisler, C.A., Dijk, D.-J. Sleep- and circadian-dependent modulation of REM density. J. Sleep Res., 2002, 11: 53–59.
Kurth, S., Jenni, O.G., Riedner, B.A., Tononi, G., Carskadon, M.A., Huber, R. Characteristics of sleep slow waves in children and adolescents. Sleep, 2010, 33: 475–480.
Lakatos, P., Szilágyi, N., Pincze, Z., Rajkai, C., Ulbert, I., Karmos, G. Attention and arousal related modulation of spontaneous gamma-activity in the auditory cortex of the cat. Brain Res. Cogn. Brain Res., 2004, 19: 1–9.
Llinás, R., Ribary, U. Coherent 40-Hz oscillation characterizes dream state in humans. Proc. Natl. Acad. Sci. U. S. A., 1993, 90: 2078–2081.
McKinney, S.M., Dang-Vu, T.T., Buxton, O.M., Solet, J.M., Ellenbogen, J.M. Covert waking brain activity reveals instantaneous sleep depth. PloS One, 2011, 6: e17351.
Osipova, D., Hermes, D., Jensen, O. Gamma Power Is Phase-Locked to Posterior Alpha Activity. PLoS ONE, 2008, 3: e3990.
Parrino, L., Ferri, R., Bruni, O., Terzano, M.G. Cyclic alternating pattern (CAP): the marker of sleep instability. Sleep Med. Rev., 2012, 16: 27–45.
Pivik, R.T., Broughton, R.J., Coppola, R., Davidson, R.J., Fox, N., Nuwer, M.R. Guidelines for the recording and quantitative analysis of electroencephalographic activity in research contexts. Psychophysiology, 1993, 30: 547–558.
Sallinen, M., Kaartinen, J., Lyytinen, H. Processing of auditory stimuli during tonic and phasic periods of REM sleep as revealed by event-related brain potentials. J. Sleep Res., 1996, 5: 220–228.
Stuart, K., Conduit, R. Auditory inhibition of rapid eye movements and dream recall from REM sleep. Sleep, 2009, 32: 399–408.
Tan, X., Campbell, I.G., Feinberg, I. A simple method for computer quantification of stage REM eye movement potentials. Psychophysiology, 2001, 38: 512–516.
Team, R.C. R: A language and environment for statistical computing. R Foundation for Statistical Computing, Vienna, Austria, 2012. ISBN 3-900051-07-0 , 2012.
Uhlhaas, P.J., Roux, F., Rodriguez, E., Rotarska-Jagiela, A., Singer, W. Neural synchrony and the development of cortical networks. Trends Cogn. Sci., 2010, 14: 72–80.
Waterman, D., Woestenburg, J.C., Elton, M., Hofman, W., Kok, A. Removal of ocular artifacts from the REM sleep EEG. Sleep, 1992, 15: 371–375.
Waterman, Elton, Hofman, Woestenburg, Kok EEG spectral power analysis of phasic and tonic REM sleep in young and older male subjects. J. Sleep Res., 1993, 2: 21–27.
Wehrle, R., Kaufmann, C., Wetter, T.C., Holsboer, F., Auer, D.P., Pollmächer, T., Czisch, M. Functional microstates within human REM sleep: first evidence from fMRI of a thalamocortical network specific for phasic REM periods. Eur. J. Neurosci., 2007, 25: 863–871.