Sleep Medicine 15 (2014) 1184-1195
link
DOI: 10.1016/j.sleep.2014.06.006
Péter Halásza,*, Róbert Bódizsb, Liborio Parrinoc, Mario Terzanoc
a Institute of Clinical Neuroscience, Budapest, Hungary
b Institute of Behavioral Science, Budapest, Hungary
c Department of Neuroscience, Sleep Disorders Center, University of Parma, Italy
* Corresponding author at: 1026 Lotz K. str. 18, Budapest, Hungary. Tel.: +3670 370 8401; fax: +361 200 2105. E-mail address: halasz35@gmail.com (P. Halász). http://dx.doi.org/10.1016/j.sleep.2014.06.006 1389-9457/© 2014 Elsevier B.V. All rights reserved.
Keywords:
Sleep homeostasis
Instant sleep homeostasis
Sleep slow oscillation
Reactive slow waves
K-complex
Cyclic Alternating Pattern (CAP)
Plastic sleep functions
Abstract
In this paper we reviewed results of sleep research that have changed the views about sleep slow wave homeostasis, which involve use-dependent and experience-dependent local aspects to understand more of the physiology of plastic changes during sleep. Apart from the traditional homeostatic slow-wave economy, we also overviewed research on the existence and role of reactive aspects of sleep slow waves. Based on the results from spontaneous and artificially evoked slow waves, we offer a new hypothesis on instant slow wave homeostatic regulation. This regulation compensates for any potentially sleepdisturbing events by providing instant “delta injections” to maintain the nightly delta level, thus protecting cognitive functions located in the frontal lobe. We suggest that this double (long-term /instant) homeostasis provides double security for the frontal lobes in order to protect cognitive functions. The incorporation of reactive slow wave activity (SWA) makes sleep regulation more dynamic and provides more room for the internalization of external influences during sleep. © 2014 Elsevier B.V. All rights reserved.
1. Introduction
1.1. Slow waves and sleep homeostasis
1.1.1. Wake/sleep dependent slow waves and sleep homeostasis The recognition of slow waves known as delta (D) waves (standing for disease, degeneration, and death according to the classical electroencephalography or EEG terminology) is attributed to the work of William Gray Walter, one of the pioneers of brain research, in the 1930s [1]. The strong link between slow waves and sleep was first reported by Alfred Lee Loomis in the 1930s [2]. He also described the increase in the amplitude of delta waves over the course of wake–sleep transition until reaching deep sleep. Most important he also recognized the reactive nature of slow waves and accurately described the K-complexes evoked by knocking on the sleepers’ door (K standing for ‘knock’). Pappenheimer et al. [3], while searching for a physiological measure for sleep deprivation-induced sleep rebound, recognized that the best measure is sleep EEG slow wave activity. The classical frequency range for delta waves was considered to be 1–4 Hz. The two-process sleep model of Borbély was based on power spectrum calculations estimating slow waves in the range of 0.75–4.5 Hz [4]. Steriade and co-workers later published a series of papers [5–7], reporting that the cellular processes contributing to delta waves (<4 Hz) are not homogeneous, and the 0.1–1 Hz component of the delta (<4 Hz) activity has distinct cellular substrates which are of utmost importance in sleep rhythm generation. They also reported that the 0.1–1 Hz waves reflect large-scale, rhythmic hyperpolarizations followed by widespread depolarization. They showed that the hyperpolarization–depolarization sequences originate from cortical neurons and are synchronized by corticocortical connections. According to this framework, the 1–4 Hz waves reflect thalamic clock-like delta activity and cortical delta activity, while the <1 Hz component is solely of cortical origin and reflects different physiological processes [8]. A detailed description of sleep rhythm generation in the thalamocortical system was also given. This suggested model was based on the hypothesis that the hyperpolarization-rebound sequences of thalamocortical feedback loops generating spindle and delta waves are triggered and grouped by the depolarization phases (up states) of slow oscillation [7]. The distinction between slow oscillation and delta waves was confirmed by the sleep recordings performed in animal models lacking T-type Ca2+ channels. The lack of this channel resulted in a significant decrease of delta and spindle oscillations, but not of slow (<1 Hz) oscillation, which remained unaffected [8]. Other molecular evidence for the differentiation between slow oscillation and delta waves has come from pharmaco-EEG studies of sleep. Benzodiazepine hypnotics decrease non-rapid eye movement (NREM) sleep EEG power in the delta range (>1 Hz), but may significantly increase the slower (<1 Hz) frequency components [9]. Moreover, only low EEG frequencies (<1.5 Hz), but not higher frequency delta activity, are affected by noradrenaline depletion in sleep-deprived rats: neurotoxic lesions with DSP-4 reduce 0.5–1.5-Hz activity in recovery sleep, while >1.5-Hz activity remains unchanged [10]. At this point we should mention that animal models have limited validity in this review since frontal lobes, which play a crucial role in slow wave oscillations during sleep, are underdeveloped in animals. Also, the significance of the different EEG frequency bands can be profoundly different in humans and other mammals. Slow waves have gained importance particularly since the recognition of homeostatic regulation of sleep by Wilse Webb [11] and Feinberg et al. [12], and the integration of the theory into a mathematical model by Borbély and co-workers in the 1980s [4,13]. They have shown that the depth of sleep measured by power of 0.75– 4.5 Hz slow wave activity is related to the duration of preceding wakefulness. Dijk et al. [14] have shown that an exponential increase of delta power is apparent during daytime naps, while nocturnal sleep is characterized by an exponential decrease of delta power throughout the night. The presence of a slow wave rebound after sleep deprivation [3,4] strongly indicates that there is a biological need for slow waves, and that the homeostatic regulating mechanism of slow waves serves this need. Thanks to the above mentioned pioneers who revealed the nature of sleep homeostasis 30 years ago, we learned that slow waves are precisely regulated in sleep/wakefulness, and this ‘slow-wave economy’ certainly has an important role. However, until recently it was not clear which factors exponentially increase the amount of slow waves during the day and what kind of physiological processes take place when the increased slow waves exponentially decay during sleep.
1.1.2. A precise slow wave economy and sleep homeostasis
Although the time course of delta activity is characterized by a steeper decline over the sleep cycles (NREM periods) than the time course of the slow oscillations, in physiological conditions both seem to be under precise homeostatic regulation [15]. Slow wave oscillations (<1 Hz) have two phases: hyperpolarization (negative values measured by surface EEG), during which cortical neurons are mostly silent, and depolarization (positive values measured by surface EEG), during which most cortical neurons fire intensively [16,17]. There is evidence for the importance of the relationship between the length of these hyper- and de-polarized phases and homeostatic regulation. Under high homeostatic pressure, short periods of depolarized phases alternate with long periods of hyperporalized phases. Conversely, under low homeostatic pressure, long depolarized phases are interrupted by short hyperpolarized phases [18]. Thus, high homeostatic pressure promotes longer hyperpolarization periods. Additionally, it has been shown that higher homeostatic pressure is associated with higher slow wave density, higher amplitudes, and steeper slopes of the down-states of slow oscillations (<1 Hz) [19–22].
1.1.3. Changing concepts of sleep homeostasis – I: from global to local sleep Over the last 15–20 years, local aspects of homeostatic sleep regulation have received more and more attention. The first explicit statements about the nature of local sleep were delivered by Krueger and Obál [23]. In their work they provided indirect and direct evidence indicating that cortical columns oscillate between functional states defined by changing input–output relationship, as shown by the changing amplitudes of evoked responses. Mosaics of sleeping columns can be found while other columns are awake. The longer a column is in awake-like state, the higher the probability that it will switch to its sleeping mode. The probability of finding sleeping columns also depends on the amount of afferent activity or on neuronal signals as a result of learning. Krueger et al. [24] later emphasized that sleep is a statistical phenomenon, e.g., a sum of the local sleep processes leading to global/behavioral sleep if there is a sufficiently high number of neural networks involved. In this view, local sleep differentiates the state of the different cortical columns. They suggest that the global coordination of NREM is not due to a single sleep generator, but may reflect an emergent property of loosely coupled local processes. Recent data on the functional organization of brain connectivity during sleep, as evaluated by the use of graph theory tools, have shown significant small-world network features [25,26]. Several studies have demonstrated that the recovery increase of slow-wave activity originates from frontal areas, where it is also the most prevalent [27–30]. There has been an early evidence for the role of slow-wave sleep in human frontal cognitive functions [31]. Achermann et al. [32] called attention to another site-specific feature: the dominant hemispheric prevalence in the slow wave activity (SWA) rebound following, possibly reflecting a feature of speech functions. Local sleep regulation is a crucial point in understanding the nature of sleep homeostasis. The original two-process model and its later corrections [4,33] focused only on global aspects of the process. However, it is evident from the above-cited studies that local differences are significant and robust enough for considering their involvement in the global aspect of sleep regulation or sleep need. According to this view, sleep regulation centers are “just” coordinators, providing a more or less synchronized entry of many different networks into the sleep state. Sleep-inducing centers, like the ventrolateral preoptic region, are not sleep inducers per se, but synchronizers of many local sleep needs.
1.1.4. Changing concepts of sleep homeostasis – II: from wakedependent, through use-dependent, to experience-dependent sleep Later, when local aspects of sleep regulation were increasingly evident, the concept of wake-dependency was slowly completed with the notion of use-dependency, which is in fact based on the amount of afferent inputs to a certain neural network. Beside the frontal lobes involved in the homeostatic regulation related to certain cognitive functions and the dominant hemisphere of speech areas, a usedependent increase of SWA has been observed in other brain regions after their targeted use. One of the most convincing ones is when extensive sensory stimulation of one hand before sleep led to an increase in sleep delta power in the opposite hemisphere over the somatosensory arm area [34]. An opposite intervention, immobilization of the arm, caused a local reduction of delta power in the same area [35]. Similar results were found in rats after cutting their whiskers on one side and analyzing the changes in hemispheric asymmetry in their sleep SWA [35]. These studies clearly showed that it is a set of specific physiological correlates of sensory stimulation which require some kind of recuperation, not simply the amount of wakefulness. Furthermore, this demand is reflected by the increase in slow wave power during daytime naps/nighttime sleep, and the assumed recuperation is possibly connected with the overnight decay of slow wave activity in sleep. The importance of the quality of wakefulness – the amount of new experiences that subjects faced during wakefulness – was also shown to alter subsequent slow-wave sleep in a field study of Horne and Minard [36]. Subjects of the experiments of this study were unexpectedly involved in different playful activities: they had a car journey to another city, they visited a large exhibition center and a museum, and they were invited to a whole-day program in an amusement park and a zoo, instead of boring paper-and-pencil tests. Although physical activity was not enhanced during these programs, its effect on the subsequent slow-wave sleep was evident during the sleep laboratory examination [36]. The above study was in fact a forerunner of experiments which demonstrated that it is learning and synaptic plasticity – or in subjective terms–our experiences – which determine the need for sleep-dependent slow wave activity in the corresponding brain area. In an influential high density EEG study of Huber et al. [37] authors revealed that pre-sleep implicit learning of a visuo-motor coordination task resulted in a local increase in sleep-dependent delta EEG (1–4 Hz) activity over the contralateral brain regions specifically involved in the execution of the test. The increase was significant in comparison with the same amount of stimulation without the learning of the coordination. Moreover, the learning-induced local increase in sleep-dependent delta EEG activity correlated positively with overnight improvement in behavioral performance. Thus, the experiments have revealed that the increase of slow wave activity due to the wake time experiences is only one part of the story. If daytime experiences lead to successful implicit learning, the increase of local slow wave activity in the subsequent night leads to an increase in plastic changes underlying learning. Stickgold and coworkers [38] have confirmed that at least some kind of learning (learning of a texture discrimination task) may occur only after a night of sleep. Sleep-deprived subjects fail to improve on texture discrimination even after two recovery nights. SWA is the tool used for this process. Huber et al. [39] used median nerve paired associative stimulation followed by transcranial magnetic stimulation (TMS) pulses to the contralateral cortical hand area. This procedure led to long term potentiation (LTP) or long term depression (LTD) of cortical excitability. During subsequent sleep, SWA increased or decreased locally in subjects responding with an increase or decrease of cortical response, respectively. Furthermore, during subsequent sleep, SWA increased or decreased locally after paired TMS stimulation. Changes in TMS evoked cortical EEG response and changes in SWA were localized in similar cortical regions and correlated positively. Thus, they revealed a tight relationship between cortical plasticity and sleep intensity. If we extinguish SWA by acoustic stimulation [40], the subsequent improvement after daytime training will be lost. Recent studies have shown that procedures presumably leading to local plastic changes in the cerebral cortex are associated with local changes in SWA during subsequent sleep. Generalizing these results, it seems that sleep is a plastic process affected by waking experiences.
1.1.5. On the function of sleep slow waves
Recent results demonstrating a relationship between sleep slow wave homeostasis and plastic functions of the brain started to provide explanations of why slow wave activity is necessary and why it is so precisely regulated. These results also changed the view of sleep researchers and have led to the generally accepted theories: slow waves are not merely passive expressions of reduced cortical activity due to brain lesions or low arousal; rather, they represent active self-organizational forms of neuronal activity, serving some important recuperative functions. Another interesting aspect of the relationship between sleep and cognitive functions is how day and night functions are interconnected. Daytime use of a function (e.g., a cognitive task) led to an increase in slow-wave sleep intensity over the cortical representation of the function. This increase is associated with an improvement of the same cognitive performance. Thus, day and night (waking and sleeping) are strongly interconnected, and sleep supports learning processes. Therefore, there is growing evidence supporting the view that NREM sleep, especially slow-wave sleep homeostatic regulation, is governed by use-dependent plasticity processes. In other words, slow-wave homeostasis and use-dependent plasticity are probably two sides of the same coin representing the biological function of slow-wave sleep. The most coherent and well-established current hypothesis of sleep function is the so-called synaptic homeostasis hypothesis [41] which places slow wave homeostasis at the center of the concept. The hypothesis is based on the well-evidenced assumption that a large amount of long lasting enhancement in signal transmission (long term potentiation – LTP) occurs between many pairs of neurons in cortical circuits during wakefulness. This ability of chemical synapses to change their strength by synchronized stimulation is widely considered one of the major cellular mechanisms that underlie learning and memory. The main statement of the hypothesis is that the homeostatic regulation of sleep slow wave activity is tied to the amount of synaptic potentiation of the preceding waking state: the higher the amount of potentiation in cortical circuits during wakefulness, the higher the increase of slow wave activity during subsequent sleep. As we have seen, several studies have demonstrated that not only the duration of wakefulness, but also the facilitation of synaptic potentiation by use-dependent tasks is responsible for the homeostatic drive increasing slow wave activity. The homeostatic increase in slow activity was shown to be present for regional involvement in special localization related tasks, and the frontal lobe proved to be especially sensitive for this homeostatic drive [28,42]. The association of synaptic potentiation with developmental periods of early childhood when plastic changes are most abundant, and with high amount of sleep delta activity while decay of potentiation in the elderly associated with important decrease of sleep slow waves fits very well into the hypothesis. The hypothesis was supported by studies that applied TMS before sleep onset to manipulate slow wave oscillations during sleep [43,44]. Their results showed that TMS-evoked responsiveness, representing synaptic potentiation prior to sleep, enhanced local slow wave activity, whereas TMS-evoked decrease in cortical responsiveness reduced slow wave activity locally during subsequent sleep. The exponential decrease of slow wave activity across the sleep cycles described by the Borbély group represents the strong electrophysiological fingerprint of this downscaling process. Downscaling probably represents a certain cleaning and refreshing synaptic capacity for new learning. Tononi and Cirelli [41] stated that space and energy savings as well as increases in signal-to-noise ratio are functions of the slow wave-related synaptic downscaling process in sleep. Extended wakefulness or sleep deprivation does not only lead to a net increase in synaptic weights but also to a concomitant occlusion of the LTP process. This is probably due to the saturation of the neural networks [45]. The reversible loss of consciousness during sleep is advantageous excluding any interference with the downscaling process. Very much in agreement with the hypothesis, H215O PET studies measured the cerebral blood flow and showed a decrease in the flow in the morning after a night sleep compared with the values of the end of a waking day [46]. Furthermore, blood flow values proved to be less and less parallel with the decrease of slow wave activity along the sleep cycles. Sleep deprivation results in the well-known negative cognitive symptoms which also fit into the expectation of the hypothesis because of the synaptic overload without downscaling possibilities. Insomnia associated with hyperarousal also impairs synaptic homeostasis and, consequently, results in fatigue, concentration difficulties, cognitive impairment, and irritability. Depression, which is epidemiologically related to insomnia and associated with memory disturbances, is also related to a so-called hypofrontality, demonstrated by neuroimaging studies and disrupted sleep pattern [47]. Sleep deprivation which accumulates slow wave activity brings transitory benefit for these symptoms. The ever enigmatic effect of electroshock therapy may also be explained by the synaptic homeostasis hypothesis, since the therapeutic effect might be due to artificially induced synaptic up- and downscaling. However, the neurophysiological mechanism of synaptic downscaling and its relationship with slow waves is at present poorly understood. Certain newly published experimental data challenge the synaptic homeostasis theory of Tononi and Cirelli [41]. Chauvette et al. [48] show that the somatosensory cortex N1 response amplitude is increased rather than decreased after the initial period of SWS and this condition remains unaltered by subsequent SWS and REM periods. Grosmark et al. [49] show that while the global firing rate of pyramidal cells and interneurons in the hippocampus increases during SWS, this increase is outweighed by decreases in firing across REM sleep, which leads to a net reduction of firing over the whole sleep period. However, the within-ripple firing rate of pyramidal cells, presumably reflecting local replay of newly encoded memories, increases across the complete NREM–REM–NREM cycle. In a commentary, Born and Feld [50] claim that these data do not question the concept of global synaptic downscaling during sleep but instead suggest that processes during REM sleep should be taken into consideration. Besides, the findings of Grosmark et al. [49] provide an interesting link between the global processes of downscaling and the local networks’ transitory upscaling activity.
1.1.6. Developmental issues
Characteristics of sleep slow wave oscillations are strongly agedependent. In general, increasing age is accompanied by decreases in the amplitude of slow waves. Frontal delta waves show greater sensitivity to age-related changes [51]. Slow waves show extensive maturational changes from childhood through adolescence. This decrease seems to be parallel with the massive synaptic remodeling during this developmental period. In the recent work of Campbell et al. [52] the relationship between brain maturation reflected in the delta decline and puberty was investigated among adolescents (age 9–18 years). This large work showed a highly significant relationship between the age of most rapid pubertal maturation and the age of most rapid delta decline. These authors suggest that the timing of cortical synaptic pruning is underlying delta decline and it is closely related to pubertal timing. Based on imaging data, close relationships were found between cortical maturation indexes and the rate of slow wave decrease. Therefore sleep slow wave measures can be good markers for structural changes in neuronal networks [53,54]. Recently, explicit models have been formulated about the relationship of sleep slow wave activity with synaptic pruning [54,55], as well as about the involvement of sleep slow wave activity in tilting the balance between the formation of new synapses and the elimination of existing ones [56]. These models convey the idea of the tight relationship between age-dependent changes in neural plasticity and sleep slow wave activity. 1.1.7. Sleep slow waves and plasticity in aging Sleep slow wave activity show characteristic changes with age, with a substantial reduction in slow wave sleep and slow wave activity. This reduction starts even in middle-aged individuals [57,58], and extends to the slow wave rebound phenomenon during daytime recovery sleep after sleep deprivation [59]. Older individuals have lower slow wave amplitudes and lower slow wave density especially over the prefrontal and frontal areas. Slow waves of older individuals have lower slope and longer positive and negative phases [27] compared to those of younger people. These age-related changes suggest that in a more advanced age, it takes more time for cortical neurons to synchronously enter hyperpolarization and depolarization phases. Taking these important changes into consideration, along with the assumed role of slow waves in learning and plasticity, the reduction of slow wave activity with increasing age may have a negative effect on plastic abilities of the older brains.
1.2. Reactive sleep slow waves
In this part of the review we will discuss another feature of slow waves: their elicitability by sensory stimuli. This aspect is not as well-known as their homeostatic aspects. Reactivity appeared as a leading aspect in sleep micro-structural approach which explored the dynamic relationship between the sleeping individual and environment in the last 30 years [60]. This approach emphasized the role of arousal in the dynamic structure of sleep. It showed that arousal is not merely a disturbance of sleep, but an integral part of sleep regulation [61]. It also demonstrated the state-dependent responsivity of NREM sleep, associated with the ascending or descending slope of sleep cycles. It turned out that during high homeostatic pressure periods of sleep, the response to sensory input is different from the traditional arousal pattern: it is a sleep-like answer with antiarousal functions.
1.2.1. K-complexes
1.2.1.1. Reactivity of K-complexes. The first observational evidence for the elicitability of delta waves was the discovery of K-complexes (KCs) [62–64]. Even from the start, the attention of observers has been attracted by the resemblance of the spontaneously occurring isolated slow waves with those that they were able to induce by external stimuli delivered during sleep. Later the contradictory characteristics of KCs gave a difficult task to sleep readers since it was not clear whether KC is an agent of sleep protection, or of arousal. Two recent KC reviews are available to give a broader overview beyond the scope of this paper [65,66]. KCs are easily distinguishable in stage 2 sleep as spontaneously occurring phasic events. In deeper stages, high-voltage slow waves practically absorb KCs, but with averaging, the same kinds of KC-like waves have been elicited in stage 3–4 sleep [67–69]. The frequency of spontaneous KCs is between 1 and 2/min in stage 2 according to most studies [70]. Components of the potential components that occur in response to short tone beeps in NREM sleep stages 2–3 are generally accepted as the following: N100, P200 (or 250), N300 (or 350), P400, N550, P900, N1500, and P1900. It was shown that N350 can be present even when N550 and P900 are not, and it can be considered as identical with the “vertex sharp wave” [71]. According to the LORETA studies of Riedner et al. [72] the traces of the evoked sensory responses of the stimulus by which it was evoked are present in the initial segments of both evoked and spontaneous KCs. The main negativity of K-complexes are characterized by frontal dominance as showed by Ujszászi and Halász (1988) [67] and Bastien and Campbell (1992) [68]. The first studies of K-complexes showed that they are elicitable by several modalities of sensory stimuli [65,69,72–75] but most easily by acoustic stimuli, and are accompanied by autonomic discharges identical to those seen for arousals [76–83]. Laurino et al. [75] have shown that different modalities of sensory evoked potentials act as traveling cortico-cortical excitations. When they reach the fronto-central region, depending on the reactivity of cortex in different NREM sleep levels, they elicit a biphasic slow wave response: the KC. The elicitability of KCs proved to be different along the descending and ascending slopes of the sleep cycles [70,84]. The spontaneous occurrence rate as well the elicitability is higher during the ascending slopes of the sleep cycles. This feature is different from the general behavior of non-KC slow waves. This is perhaps due to the higher dependency of KCs on sensory input on the ascending slope. The above relationship is another example of the nature of KCs which has been referred to as ‘Janus-faced’.
1.2.1.2. Relationship between evoked KCs and sleep homeostasis.
We mentioned above that KCs sometimes behave as sensory evoked potentials, with some arousal features as well. Conversely, KC has other features which behave as slow waves, following homeostatic rules. Frequencies of KCs have shown decreasing tendencies in stage 2 from evening to morning from cycle to cycle, just like slow waves [85]. We have shown that the amplitudes of KCs measured in stage 2 are proportional to the depth of the actual sleep cycle in which they were measured [84]. They demonstrate a rebound similar to slow waves regarding their spontaneous and evoked incidence rate after sleep deprivation [86]. However, Bastien and Campbell (1994) in Ref. [87], in their earlier study, have found the average amplitude of KCs to be higher in stage 2 compared to slow wave sleep stages. However, the deepness of the cycle where they measured the KC amplitudes and the differences according to the descending and ascending slopes were not taken into consideration. Furthermore, the studies of Amzica and Steriade [88] and later Cash et al. [89] proved that the main surface-negative large N550 component of KCs is characterized by a prominent decrease of unit discharges and synaptic activity in the frontal cortex similar to the “down-state” of the cortical slow oscillation during NREM sleep. Crowley et al. [90] described that the number and density of K-complexes were all significantly lower in elderly subjects compared to young adults. Colrain et al. [91] showed that the effect of aging on KCs is similar to sleep slow waves: as aging proceeds, the density and amplitudes of KCs decrease, and this process is parallel with the shrinkage of cortical thickness [92]. Nowadays, it has become clear that KCs are “Janus-faced,” reflecting both reactive and sleep-protecting homeostatic features. As it will be shown in the next parts of the review, slow wave activity in general follows this dual behavior, showing both homeostatic and reactive features. 1.2.2. Periodic slow wave bursts and the Cyclic Alternating Pattern (CAP) In the middle of the 1980s, Terzano and co-workers [93] recognized a new micro-structural level cyclicity in NREM sleep. They claimed that periodic activation patterns with an inter-pattern interval of 20–40 seconds constitute an important part of sleep, forming input-associated alternations of activation (A) and background (B) periods. Sensory input activates A phases when applied in B periods in the same way they appear spontaneously. Later they recognized that activations are not homogenous and classified A phases in three forms: A1, A2 and A3. A1 had purely slow wave constituents (KCs and slow wave groups) with little autonomic and muscle concomitants. A3 was equal to the traditional arousal pattern with desynchronized fast activity, autonomic signs, and increases in muscle tone. A2 was a mixture of A1 and A3 features, usually beginning with slow waves and followed by the arousal pattern. They also stated that an A1 pattern appears mainly during periods of high homeostatic pressure (first cycles and descending slopes of cycles), while A2 and A3 patterns appear when the homeostatic pressure is low (last part of sleep and ascending slopes) [94]. Topographic mapping studies of the CAP revealed that spectral components with anterior frontal prevalence were found in A1 type (0.25–2.5 Hz) events, while those in the A3 type (7–12 Hz) events have a different prevalence over the parieto-occipital areas. The low frequency components (A1) were expressed closer to the midline and the higher frequency bands (A3) were rather distributed over the parieto-occipital convexity [95]. The highest synchronization between the two hemispheres was found in the electrode pair F4– F3 [96]. A phase types of either spontaneous or stimulus dependent variations proved to be functionally and also fundamentally different. The synchronization-type (sleep-like) response does not promote arousal: on the contrary, it represents an “antiarousal” [97] or a sleep promoting feature. The distribution of different CAP A types across the sleep cycles also points to their different nature. Terzano et al. [60] analyzed how CAP is involved in the homeostatic and ultradian sleep dynamics. CAP A1 rate in NREM sleep undergoes a characteristic significant exponential reduction from the beginning to the end of sleep. This is parallel with the behavior of slow wave activity and the homeostatic decay of Borbély’s S process and congruent with our results about KCs showing a similar time course across the sleep process. At the same time, the rate of A2–3 events demonstrated a different distribution with cyclic peaks before the REM periods on the ascending slopes of cycles, without any dampening during the course of sleep (Fig. 1).

Fig. 1. The distribution of A1 versus A2–3 phases of CAP accross the cycles of sleep. (After Terzano et al. 2005 in Ref. [60]).
 Fig. 2. Composite figure showing the degree of homeostatic pressure along a schematic sleep cycle (upper row) and the A1-A2-A3 CAP phases (middle row) distribution along the cycle. The perpendicular arrows during the descending and ascending slopes of the sleep cycle represent environmental input. The colored inserts (lower row) show spontaneous (left) and evoked (right) K-complexes and slow oscillation (middle) recorded during stage 2 by intracortical multi-microwires with coregistered multiunit activity and current source density in human subjects. Red arrow indicates inward currents (sink) in super ficial cortical layer and blue arrows show outward currents (source) in layers II–III. Black arrow indicates decreased neuronal firing. (Modified from Cash et al. 2009 in Ref. [89]). The cortical down state is a common denominator of K-complexes and slow waves. Evoked and spontaneous K-complexes of stage 2 sleep are common in being based on singular down states, while the down state of the slow oscillation of stages 3–4 is embedded in alternating up-down state sequences. (For interpretation of the references to color in this figure legend, the reader is referred to the web version of this article.)
This suggests that input-dependent A1 events are part of the framework of slow wave sleep and follow the course of the homeostatic process. A2–3 events, on the contrary, belong to the wake/ REM-promoting system and take part in the arousal regulation of NREM sleep (Fig. 2). The percentage of CAP time in NREM sleep (CAP rate) is agedependent [98] (Parrino et al. 2012). It increases from preschool age (25.9%) to peri-pubertal age (62.1%), then slightly decreases in middle age (37.5%), and it again increases significantly in senescence (55.3%). If we analyze the CAP rate independently for the three subtypes, the peri-pubertal peak can be attributed to the prevalence of A1 types, while the peak in senescence results from an increase of A2–A3 rate (Fig. 3). CAP rate of 1–4 months old infants is dominated by A1 types (85.2%) and its course of change over the lifetime is parallel to the change of sleep slow wave rate (Fig. 3 insert). In sum, a ratio of over 80% of A1 type was observed in infancy, school and peripubertal ages at the milestones of mental development. The course along lifetime shows opposite trends for A1 and A2–A3 type A phases: while A1 rate is decreasing, A2–A3 rate is increasing. The opposite trends converge around the age of 60. Further studies have revealed that the reactive slow wave content of CAP contributes to several specific aspects of plastic sleep functions. Ferri et al. [99] have shown that the local slow wave increase in NREM sleep and the related increase in performance after an evening motor learning test significantly correlated with the increased number of A1 CAP subtypes, but not with an increase of subcontinuous slow waves (nonCAP). Furthermore, the results of experimental sleep fragmentation studies suggest that CAP A1 subtypes are associated with higher cognitive functioning, while other CAP subtypes are associated with lower cognitive performance in young healthy subjects [100,101]. Similar results were obtained in children. Bruni et al. [102] demonstrated that children with higher cognitive efficiency have an increased number of CAP phase A1 in total sleep and in slow wave sleep. These analyses have been extended to children with intellectual disabilities and developmental neurocognitive dysfunctions with the prospect of creating a “sleep microstructure phenotype” of children suffering from various abnormal neurocognitive properties [103]. Studies on the CAP system, conducted in an overwhelming majority by the Parma group and collaborators, are of utmost importance in understanding how sleep is adapted to incoming impulses by this level setting and self-regulatory device, using up these impulses to maintain or even build up sleep. The differences between the three groups of CAP A phases (A1, A2, A3) may indicate the actual dynamic state of balance between the oscillations of sleep- and wake-promoting forces, originating from reciprocal antagonistic brain stem networks that determine cortical responsiveness. A3 type microarousals may mean an actual wake promoting preponderance, A1 may indicate the preponderance of sleep promoting forces, whereas A2 reflects an intermediate state when sleep promoting preponderance is weak and a breakthrough of wake promotion happens. In sum, the cyclic nature of CAP also shows Janus-faced features serving sleep promotion when homeostatic pressure is high and arousal when it is low.
1.2.3. Artificial boosting of slow wave oscillations during sleep
Recently, the possibility of boosting sleep slow waves has been shown in several studies. It was shown firstly by Marshall et al. [104], who induced slow oscillation-like field potentials by transcranial application of polarizing current through bilateral fronto-lateral anode and mastoid (cathode) electrodes during early nocturnal NREM sleep oscillating at a frequency of 0.75 Hz. The artificially evoked slow oscillation immediately induced slow wave sleep and entrained slow spindle activity over the frontal cortex as well. Stimulation has a facilitating effect on the mnemonic retention of hippocampus-dependent declarative memories in healthy human subjects. Massimini et al. [43] were able to trigger sleep slow waves resembling spontaneously occurring ones by TMS. These slow waves contained spindle activity similar to the up-states of spontaneous slow activity. The well known traveling properties [105] of these waves were also similar to their spontaneous counterpart. Stimulation-induced slow waves spread over the adjacent cortical areas. This phenomenon proved to be state-dependent and has been elicited exclusively during sleep and not in wakefulness. Applying the stimulation in stage 2 quickly led to a transition to stage 4. Vyazovskiy et al. [18] studied the effect of intracortical electrical stimulation with brief (0.1 ms) pulses during sleep in rats. The stimuli reliably triggered local field potentials that were indistinguishable from naturally occurring slow waves. The elicited local potentials were followed by sleep spindles. They were larger in early sleep compared to late sleep, and had steeper slopes and fewer multipeaks. Therefore, they were quite similar to spontaneous slow waves. The possibility of inducing slow waves was strongly influenced by the proximity to the preceding spontaneous slow wave. If the stimulus was delivered immediately after a large spontaneous slow wave, no answer could be elicited at all. An important finding of this study was that parameters of evoked slow waves change as a function of homeostatic sleep pressure. In case of increased sleep pressure sleep-like responses were more abundant and the slopes of the evoked slow waves were also steeper.
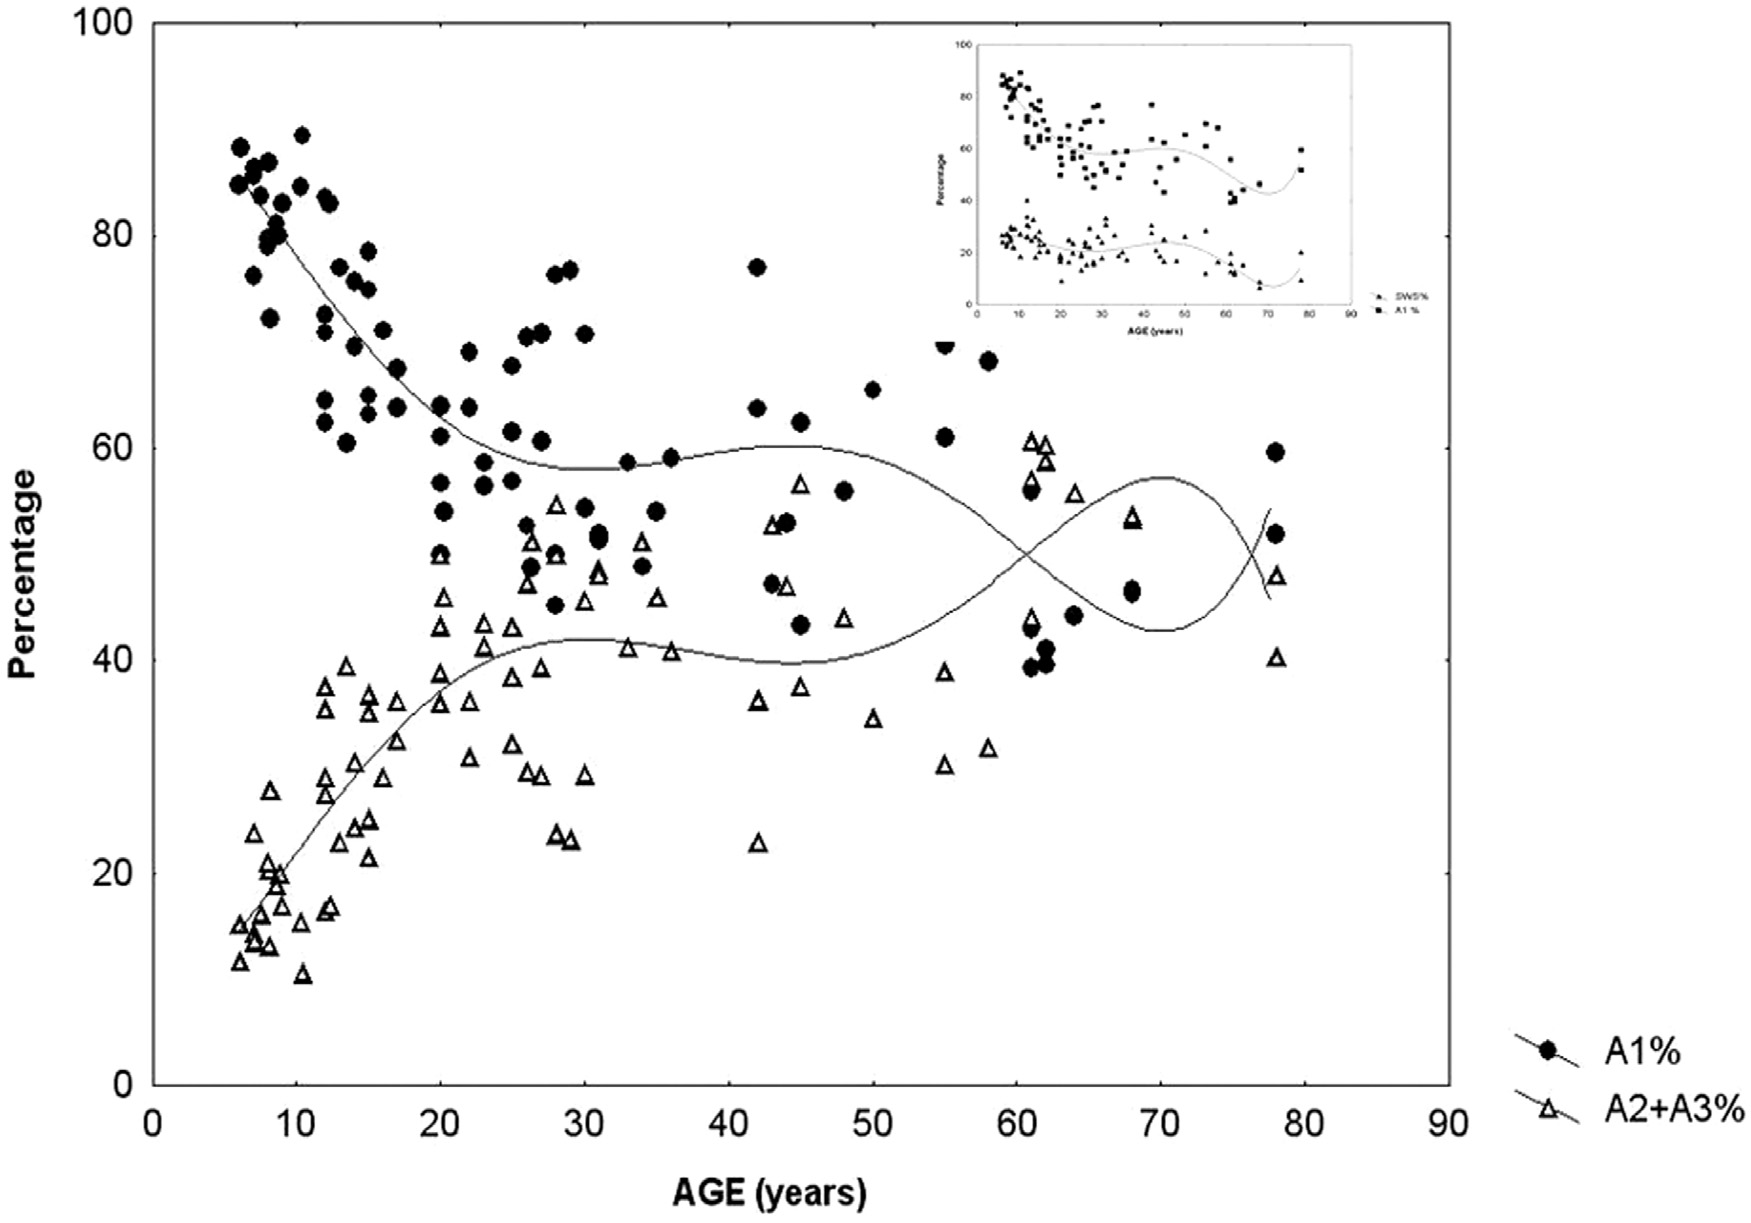 Fig. 3. Percentage of CAP A1 versus A2–3 phases during sleep in different ages of life. The insert on the right upper corner shows the parallelity of CAPA1 and slow waves
distribution across ages. (Modified from Parrino et al. 2012 in Ref. [98]).
Cortical reactivity during NREM sleep was explored during presurgical evaluation of epileptic patients using single pulse cortical electrical stimulation (CES) via subdural electrodes [106]. We obtained an initial biphasic activation composed by a long lasting negative ECoG potential (down state) and rebound positivity (up state) in the close (1–2 cm) vicinity of the stimulating electrode, regardless of the distance from the epileptogenic zone. Analyzing the layer structure and multi unit activity (MUA), current source density (CSD) and time-frequency (TFR) activity, the distribution of spectral power changes over time recorded with the intracortical multielectrode system after cortical electrical stimulation was similar to the one recorded during slow oscillation. During the large surface negative component electrical parameters behaved in a manner identical to those registered during down-states of slow oscillation. All these results show that during both animal and human NREM sleep there is a possibility to release a basic slow wave response either by physiological sensory stimuli (KC, or CAP A1 phase) or by artificial brain stimulation (TMS, polarizing current or direct cortical stimulation). This input-dependent stereotype and modalityindependent response could be considered the elementary building stone of NREM sleep. Recently, Ngo et al. [107] showed that rhythmic 0.8 Hz acoustic stimulation effectively enhances sleep slow oscillation. They emphasize that the effect of stimulation was state-dependent and the entrainment of slow oscillation occurred at sleep onset. All these studies show that NREM sleep, especially sleep slow wave activity, is profoundly influenced by sensory input and that paradoxically against the traditional view, sensory stimulation is able to increase sleep depth both locally and generally.
1.3. From long term to instant homeostasis
1.3.1. Modeling sleep/wake regulation
The main part of fundamental knowledge about sleep regulation is rooted in the recognition of reciprocally antagonistic sleep– wake-promoting influences originating in brainstem/hypothalamic neuronal networks [108–111], and in their dynamic interplay. All the presently known concepts and models of sleep regulation are essentially based on the anatomy and function of these subcortical networks [112,113]. Since the beginning of this century, the Harvard School of sleep research and the Lyon sleep research group have introduced influential concepts about the working of the flipflop model of “sleep switch” governing sleep/wake alternations, and tried to connect these views with the earlier ideas explaining sleep cyclicity [109,114]. These results suggest that subcortical neuronal assemblies indeed have a governing role in the electroencephalographic and behavioral changes during the sleep/wake cycle. However, during the NREM sleep period, robust dynamic changes take place, about which the flip-flop model has nothing to say. NREM sleep cannot be taken as a “stable” state. Growing evidence about the “microstructure” of NREM sleep presents sleep as an everchanging fluctuating state intermingled with microarousals, strongly contradicting this simple model [115]. Several works tried to incorporate the effects of external and internal input factors apparently unrelated to the core sleep regulatory mechanisms yet deeply influencing their dynamism. To solve this contradiction McCarley and Massaquoi [116] began to incorporate the influence of external noise according to the observations showing frequent brief, non-behavioral EEG, and polygraphic “awakenings” in sleep. Lo et al. [117], while studying brief sleep– wake transitions, were able to show that these events can be commonly observed across different species with different sleep patterns. The universality of the distributions of short wake episodes strikingly contrasts the species-specific distributions of sleep bouts. Lo concludes that this relationship reveals a universal regulatory mechanism shaping the dynamics of sleep. Behn et al. [118] created a model of sleep/wake network composed of coupled relaxation oscillation equations. This model can be considered as a crucial one as it tries to explain the dual nature of sleep regulation: gross sleep– wake regulatory mechanisms depending on the already described neural circuitry of the flip-flop switch and a fine structure shaped by short bouts of wakefulness. We have hypothesized a parallel regulation of sleep in our model [61]. Tonic processes were hypothesized to involve mainly intracerebral, slow, and chemical influences [119], while phasic processes represent extracerebral, fast, and neuronal-synaptic input, tailoring the interaction of the reciprocal antagonistic influence between sleep and arousal centers depicted in the flip-flop model of Saper et al. [108] The specificity of our model relied on the differential analysis of the descending and ascending slopes of the sleep cycles, which are usually undifferentiated in current models of sleep regulation.
 Fig. 4. A1-2-3-rate changes during acoustic stimulation with increasing loudness. Increase of A1 rate was proportional with loudness of stimulation, while A3 was unchanged and A2 responded only mildly. (After Terzano et al. 1988 in Ref. [120]).
1.3.2. Instant sleep homeostasis by reactive slow wave activity
1.3.2.1. What is instant sleep homeostasis?
The CAP system was interpreted mainly as a marker of sleep instability and at the same time as a buffer system against perturbations of NREM sleep. Both are true, but the aspect of ‘instability’ is rather attached to the dynamics of A2–A3 events and the “buffer system” aspect is mainly a feature of the dynamics of A1 events. As sleep cycles exhibit a double “sleep promoting” function during the descending slope and a “wake/ REM promoting” effect during the ascending slope, the contrasting double nature of CAP events reflects the same alternating nature. Furthermore, if we try to consider the biological role of the CAP system, its role as an ‘instability marker’ seems to emphasize something which belongs rather to pathology than physiology. We suggest looking at the other side of the coin and considering the ‘buffer system’ aspect. In doing so, we can view the system as a short range homeostatic process in which the amount of slow wave activity is buffered instantly, therefore preserving sleep continuity. We may understand the CAP system as a natural “slow wave injection,” protecting sleep against perturbations. With the recognition of the CAP A1 features, we learned that the flow of slow waves is not continuous even within the descending slope of the first cycles, but that it appears in input-related bouts. Depending on the degree of sleep perturbation, 30–40% of sleep time is usually spent in CAP A phases [93]. CAP sequences are characterized by recurrent bouts of reactive slow activity (main frequency 0.25–2.5 Hz) in the form of A1 phases, which constitute more than 60% of all the CAP sequences. This rate is an average of all sleep. Since the presence of slow waves increases significantly in stages 3–4, leading to an increased prevalence of A1 type A phases among the A subtypes, the specific rate of reactive slow wave activity in deep sleep is much higher. Therefore we have to realize that the reactive (evoked) nature of slow waves in sleep is a prominent and functionally important feature. The early experiments of the Parma group [120] clearly showed that the spectral power of A1 and A2 phases increased proportionally under increasing sound pressure levels when 45–75 dB white noise was applied, while the spectral power of phase A3 remained unchanged. Thus the increase of reactive slow wave rate seems to be proportional to the degree of sleep perturbation by external sound (Fig. 4). When delta power increases in sleep after a night of sleep deprivation, the CAP system reacts with a robust decrease of the CAP rate [121]. Supplementation of sleep with slow waves during the night after deprivation goes against the production of CAP sequences, presumably because the sleep promoting system is under saturation. Accordingly, in the sound experiments of Terzano et al. [120] the prominence of A1–2 phases was almost unchanged even with an increasing level of sound pressure in the above-described setting with sleep deprivation. More evidence for instant sleep homeostasis is provided by an experimental sleep fragmentation study (103) where the percentage of slow-wave sleep was dramatically reduced due to sleep fragmentation and a consequent twofold increase in total CAP rate across all NREM sleep stages has been found. These results support the idea that CAP is an instant homeostatic device. Consequently, a CAP sequence does not only reflect the balance between sleep and wake promoting systems, which marks sleep instability, but at the same time represents a protective, short-term homeostatic mechanism of slow wave sleep.
1.3.2.2. Does the double homeostatic ‘helmet’ around the frontal lobes serve plastic functions?
As we described above, reactive slow wave episodes appear in NREM sleep as KCs or CAP A1 phases. A very similar direct response proved to be elicitable by artificial cortical (including transcranial magnetic) stimulation. Based on their physiological parameters we can assume that these phasic events are underlined by the same mechanism, regardless of whether they emerge spontaneously or are elicited by stimulation. As it has been recognized since the 1980s, long term homeostatic regulation of sleep slow wave activity is a prominent feature of human physiology. In the last 20 years we have learnt that as a result of increased synaptic utilization (load) during the time spent awake a multiregional increase of slow wave spectral power appears during nights. With the discovery of the CAP system, another instant (short time) homeostatic response has been revealed, which makes it possible to maintain the necessary amount of slow activity during NREM sleep. Therefore, sleep slow activity seems to be under a double homeostatic regulation: the fundamental difference between the two types of regulation is that in case of instant regulation, sleep disturbing inputs occur during sleep and the supplementation of slow waves occurs as an instant response; in case of long term regulation, the input occurs during wakefulness and the response is postponed to the next sleep period (Fig. 5). Slow wave homeostatic increase is most prominent in the left hemisphere and the frontal lobe bilateral participation [28,29,32]. Presently we do not know whether this is due to the characteristics of input factors (a preferential involvement of left-side areas for example might be evidence for greater demand on the cortical areas of the speech network) or the greater sensitivity (amount of restitutional need) of certain cortical areas (for instance, frontal areas responsible for human cognitive neofunctions). In any case, we should emphasize the prominent role of the frontal lobes which are under a double regulation with the participation of both the shortand long-term homeostatic processes. There is growing evidence supporting the view that NREM sleep, and especially slow wave sleep homeostatic regulation at the same time is governed by use-dependent plasticity processes. It may be that the full-blown development of these synergic regulations is a human-specific trait which was necessary due to the vulnerability of the cognitive functions of the frontal neocortex. A further question would address how these regulations are related to each other. Their common feature is the substrate of regulation: that is, slow wave activity. However, there are obvious differences between the two suggested mechanisms. Long term homeostatic regulation is characterized by slow procedures which represent certain metabolic demands, while instant (prevailing within the same night) slow wave homeostasis is faster, driven by neuronal/synaptic activities, and essentially by the disturbance of slow wave production in sleep. As mentioned earlier, the short term regulation by “slow wave injections” has a certain time window: it works exclusively during high homeostatic pressure. This is the very period during the ‘D’ slopes of the first sleep cycles within which the chance is high to gain supplementation of slow wave activity in case of sleep perturbations. After the decay of the slow wave production during later parts of sleep, or on the ‘A’ slopes, supplementation would not find enough slow wave “product” to fuel the homeostatic process. We can assume that the role of CAP A1-provided slow wave injections is a demand-dependent reserve of slow wave production to maintain the continuity of slow wave sleep.
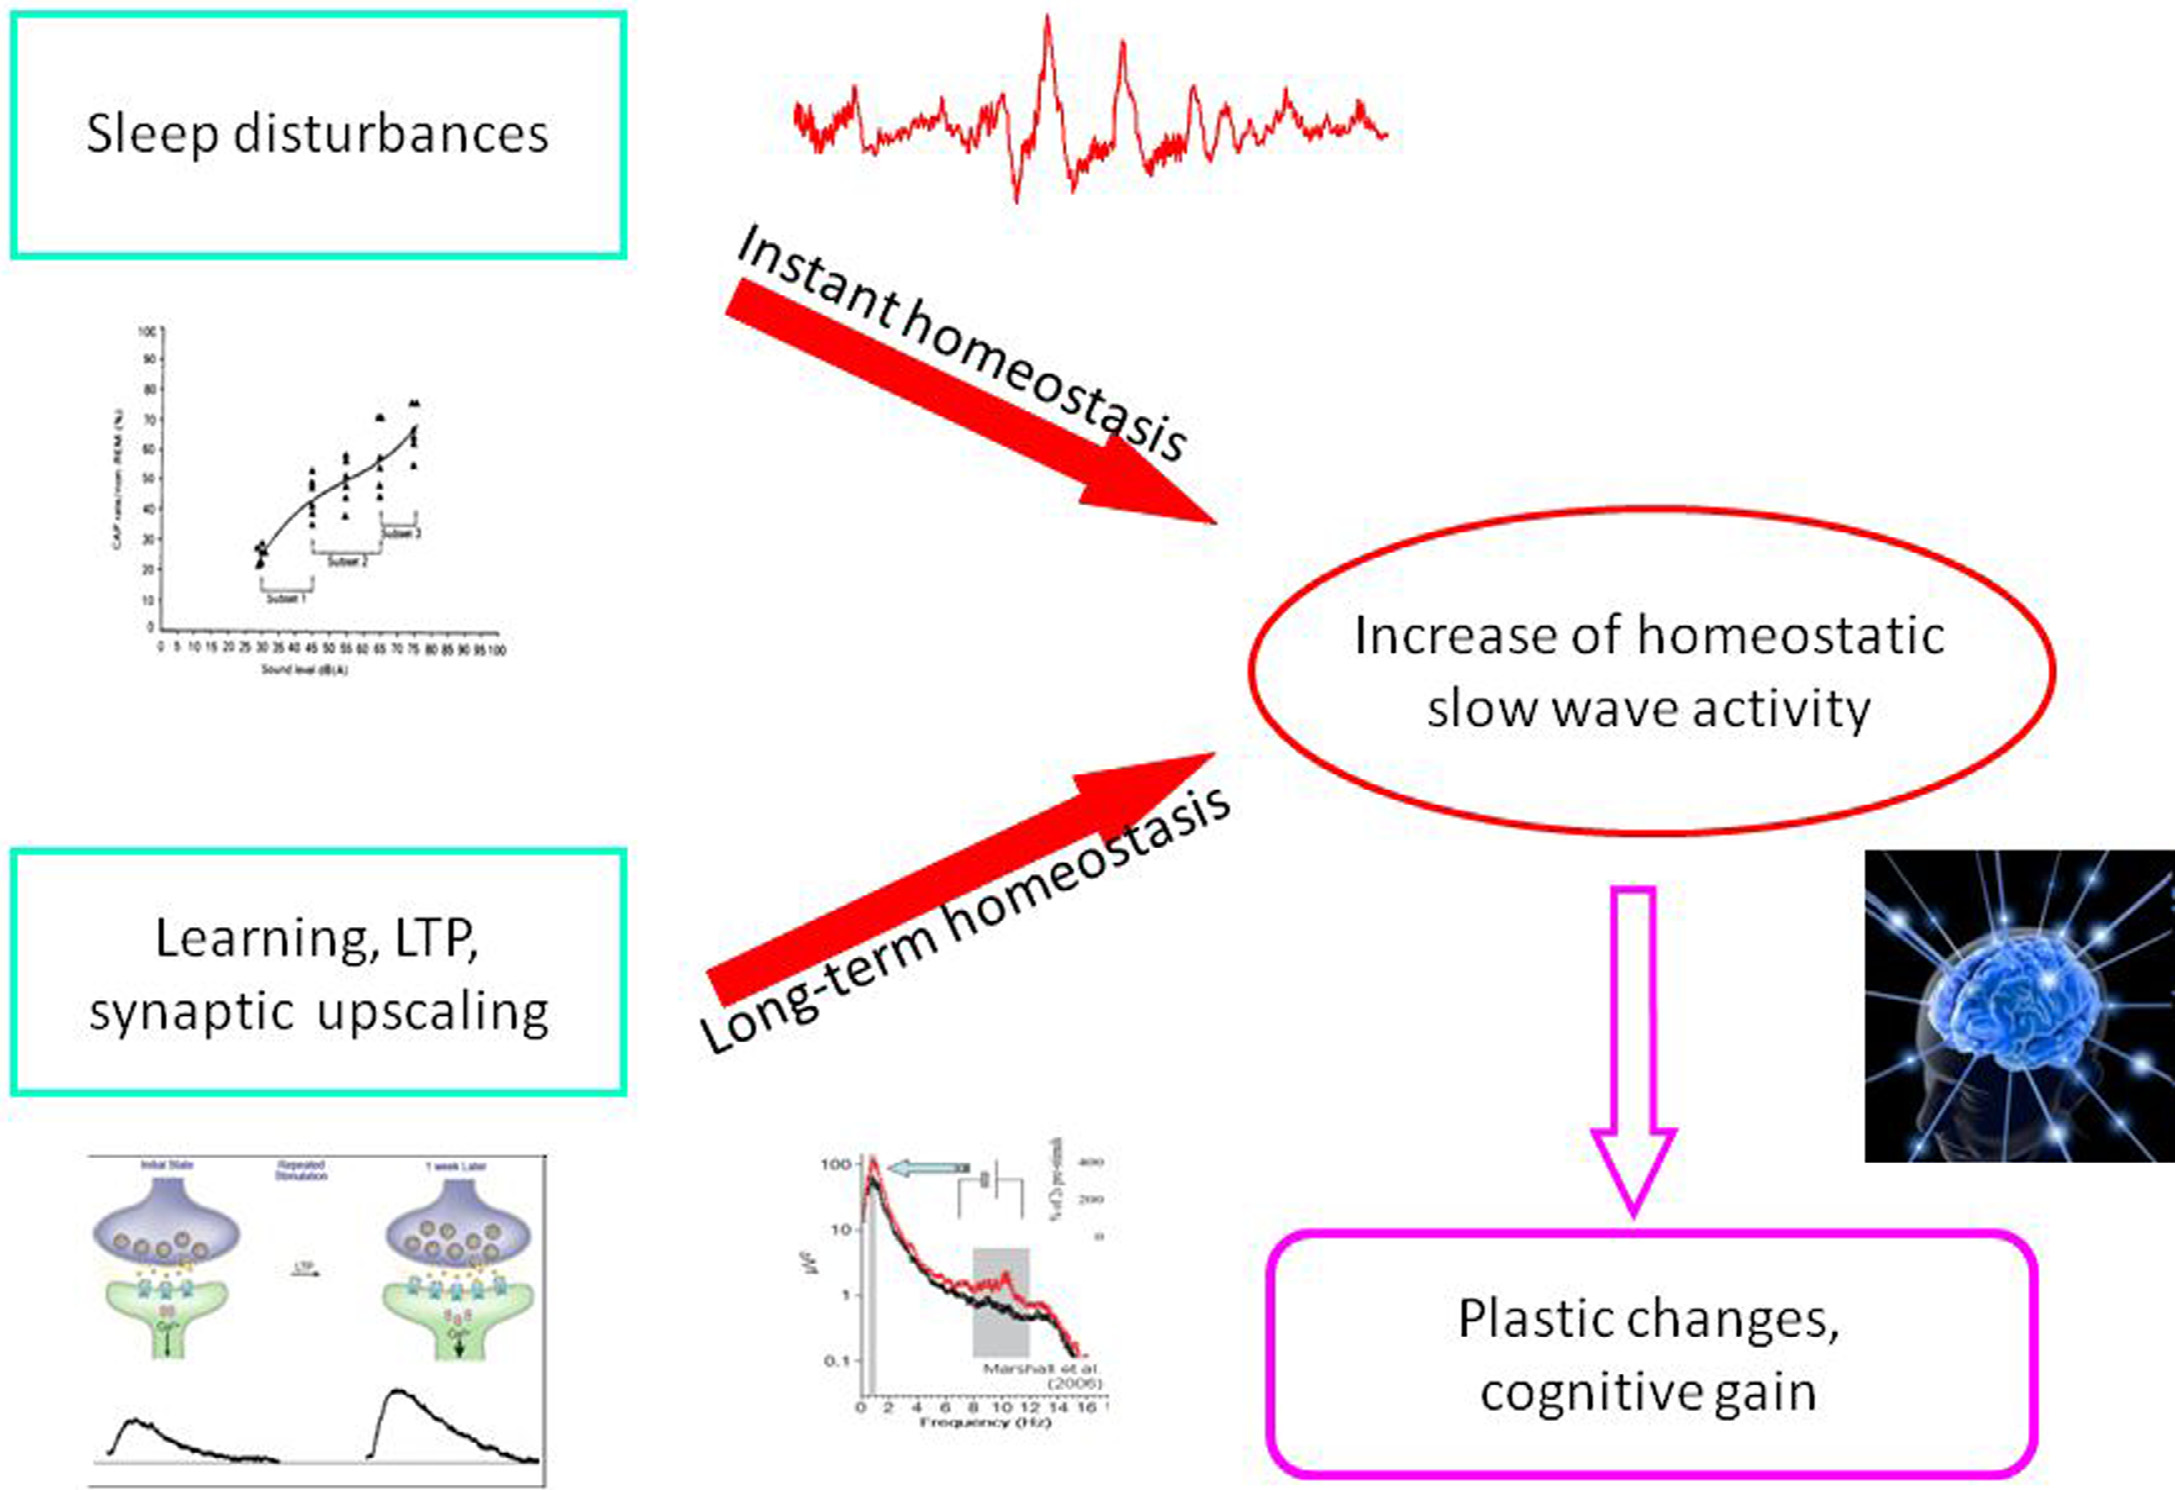
Figure 5. Schematic overview about the relationship of instant and long term (traditional) homeostasis and their tentative role in slow wave economy and plastic functions during sleep.
2. Summary and conclusions
The striking parallelism between sleep homeostasis-related dynamics, as well as the age-dependency of reactive (KCs, CAP A1 phases) and overall background slow wave activity, is apparent in the literature. Both KCs and CAP A1 phases prevail in sleep periods in which the expression of homeostatic sleep need is at a high level. These are the first periods of the nighttime sleep as well as the descending slopes of the sleep cycles. The intra-cycle dynamics of reactive slow wave elements match the well-known dynamics of slow wave activity. On the other hand, age-related changes in KCs and CAP A1 phases display features similar to the age-related nature of sleep slow wave activity. Thus, input-related reactive slow waves are elicited with the highest probability during the sleep periods and ages of prevailing spontaneous (experience-dependent or learning-dependent) sleep slow wave activity. This state-dependent reactivity seems to be an inherent part of sleep regulation. Reactive slow wave activity is an instant form of sleep homeostasis by which sleeping humans are able to adapt to the changing state of the surrounding world in a flexible way. This instant homeostatic regulation transforms incoming stimuli into slow wave activity when there is more need for sleep and interference when sleep is not too strong, while it allows arousal when the stimulation conveys more alarm and sleep propensity is low. The moment-by-moment fluctuation of transient input-related sleep slow wave patterns shapes and tailors the basic needs of sleep slow wave activity determined by synaptic upscaling (long term potentiation and learning) of the preceding wakefulness period. At the same time changes in the homeostatic demand determine responsiveness to incoming input. Thus, input-dependent phasic activity and a more constant tonic regulation of sleep fit together like the cogwheels of a clockwork mechanism. Homeostatic and reactive features of sleep slow wave activity may be interpreted as characteristics of open systems always performing a double task: separating the organism from its environment while also keeping it connected.
Conflict of interest
The ICMJE Uniform Disclosure Form for Potential Conflicts of Interest associated with this article can be viewed by clicking on the following link: http://dx.doi.org/10.1016/j.sleep.2014.06.006.
References
[1] Walter WG. The location of cerebral tumours by electro-encephalography. Lancet 1936;228:305–8.
[2] Loomis AL, Harvey EN, Hobart G. Further observations on the potential rhythms of the cerebral cortex during sleep. Science 1935;82:198–200.
[3] Pappenheimer JR, Koski G, Fencl V, Karnovsky ML, Krueger J. Extraction of sleep-promoting factor S from cerebrospinal fluid and from brains of sleepdeprived animals. J Neurophysiol 1975;38:1299–311.
[4] Borbély AA. A two process model of sleep regulation. Hum Neurobiol 1982;1:195–204.
[5] Steriade M, Contreras D, Curró Dossi R, Nuñez A. The slow (<1 Hz) oscillation in reticular thalamic and thalamocortical neurons: scenario of sleep rhythm generation in interacting thalamic and neocortical networks. J Neurosci 1993a;13:3284–99.
[6] Steriade M, Nuñez A, Amzica F. A novel slow (<1 Hz) oscillation of neocortical neurons in vivo: depolarizing and hyperpolarizing components. J Neurosci 1993c;13:3252–65.
[7] Steriade M, Nuñez A, Amzica F. Intracellular analysis of relations between the slow (<1 Hz) neocortical oscillation and other sleep rhythms of the electroencephalogram. J Neurosci 1993b;13:3266–83.
[8] Lee J, Kim D, Shin HS. Lack of delta waves and sleep disturbances during non-rapid eye movement sleep in mice lacking alpha1G-subunit of T-type calcium channels. Proc Natl Acad Sci U S A 2004;101(52):18195–9.
[9] Trachsel L, Dijk DJ, Brunner DP, Klene C, Borbély AA. Effect of zopiclone and midazolam on sleep and EEG spectra in a phase-advanced sleep schedule. Neuropsychopharmacology 1990;3:11–18.
[10] Cirelli C, Huber R, Gopalakrishnan A, Southard TL, Tononi G. Locus ceruleus control of slow-wave homeostasis. J Neurosci 2005;25:4503–11.
[11] Webb WB, Agnew HW Jr. Stage 4 sleep: influence of time course variables. Science 1971;174(4016):1354–6.
[12] Feinberg I, March JD, Fein G, Floyd TC, Walker JM, Price L. Period and amplitude analysis of 0.5-3 c/sec activity in NREM sleep of young adults. Electroencephalogr Clin Neurophysiol 1978;44:202–13.
[13] Borbély AA, Baumann F, Brandeis D, Strauch I, Lehmann D. Sleep deprivation: effect on sleep stages and EEG power density in man. Electroencephalogr Clin Neurophysiol 1981;51:483–95.
[14] Dijk DJ, Beersma DG, Daan S. EEG power density during nap sleep: reflection of an hourglass measuring the duration of prior wakefulness. J Biol Rhythms 1987;2:207–19.
[15] Campbell IG, Higgins LM, Darchia N, Feinberg I. Homeostatic behavior of fast Fourier transform power in very low frequency non-rapid eye movement human electroencephalogram. Neuroscience 2006;140:1395–9.
[16] Steriade M. Grouping of brain rhythms in corticothalamic systems. Neuroscience 2006;137:1087–106.
[17] Csercsa R, Dombovári B, Fabó D, Wittner L, Eross L, Entz L, et al. Laminar analysis of slow wave activity in humans. Brain 2010;133:2814–29.
[18] Vyazovskiy VV, Faraguna U, Cirelli C, Tononi G. Triggering slow waves during NREM sleep in the rat by intracortical electrical stimulation: effects of sleep/wake history and background activity. J Neurophysiol 2009;101:
1921–31.
[19] Esser SK, Hill SL, Tononi G. Sleep homeostasis and cortical synchronization: I. Modeling the effects of synaptic strength on sleep slow waves. Sleep 2007;30:1617–30.
[20] Riedner BA, Vyazovskiy VV, Huber R, Massimini M, Esser S, Murphy M, et al. Sleep homeostasis and cortical synchronization: III. A high-density EEG study of sleep slow waves in humans. Sleep 2007;30:1643–57.
[21] Carrier J, Viens I, Poirier G, Robillard R, Lafortune M, Vandewalle G, et al. Sleep slow wave changes during the middle years of life. Eur J Neurosci 2011;33:758–66.
[22] Bersagliere A, Achermann P. Slow oscillations in human non-rapid eye movement sleep electroencephalogram: effects of increased sleep pressure. J Sleep Res 2010;19:228–37.
[23] Krueger JM, Obál F. A neuronal group theory of sleep function. J Sleep Res 1993;2:63–9.
[24] Krueger JM, Rector DM, Roy S, Van Dongen HP, Belenky G, Panksepp J. Sleep as a fundamental property of neuronal assemblies. Nat Rev Neurosci 2008;9:910–19.
[25] Ferri R, Rundo F, Bruni O, Terzano MG, Stam CJ. Small-world network organization of functional connectivity of EEG slow-wave activity during sleep. Clin Neurophysiol 2007;118(2):449–56.
[26] Ferri R, Rundo F, Bruni O, Terzano MG, Stam CJ. The functional connectivity
of different EEG bands moves towards small-world network organization
during sleep. Clin Neurophysiol 2008;119(9):2026–36.
[27] Murphy M, Riedner BA, Huber R, Massimini M, Ferrarelli F, Tononi G.
Source modeling sleep slow waves. Proc Natl Acad Sci U S A 2009;106
(5):1608–13.
[28] Finelli LA, Borbély AA, Achermann P. Functional topography of the human
nonREM sleep electroencephalogram. Eur J Neurosci 2001;13:2282–90.
[29] Cajochen C, Foy R, Dijk DJ. Frontal predominance of a relative increase in sleep
delta and theta EEG activity after sleep loss in humans. Sleep Res Online
1999;2(3):65–9.
[30] Marzano C, Ferrara M, Curcio G, De Gennaro L. The effects of sleep deprivation
in humans: topographical electroencephalogram changes in non-rapid eye
movement (NREM) sleep versus REM sleep. J Sleep Res 2010;19:260–8.
[31] Horne JA. Human sleep, sleep loss and behaviour. Implications for the
prefrontal cortex and psychiatric disorder. Br J Psychiatry 1993;162:413–19.
[32] Achermann P, Finelli LA, Borbély A. Unihemispheric enhancement of delta
power in human frontal sleep EEG by prolonged wakefulness. Brain Res
2001;913(2):220–3.
[33] Borbély AA, Achermann P, Trachsel L. Tobler sleep initiation and initial sleep
intensity: interactions of homeostatic and circadian mechanisms. J Biol
Rhythms 1989;4:149–60.
[34] Kattler H, Dijk DJ, Borbély AA. Effect of unilateral somatosensory stimulation
prior to sleep on the sleep EEG in humans. J Sleep Res 1994;3:159–64.
[35] Vyazovskiy V, Borbély AA, Tobler I. Unilateral vibrissae stimulation during
waking induces interhemispheric EEG asymmetry during subsequent sleep
in the rat. J Sleep Res 2000;9:367–71.
[36] Horne JA, Minard A. Sleep and sleepiness following a behaviourally ‘active’
day. Ergonomics 1985;28:567–75.
[37] Huber R, Ghilardi MF, Massimini M, Tononi G. Local sleep and learning. Nature
2004;430(6995):78–81.
[38] Stickgold R, James L, Hobson JA. Visual discrimination learning requires sleep
after training. Nat Neurosci 2000;3:1237–8.
[39] Huber R, Määttä S, Esser SK, Sarasso S, Ferrarelli F, Watson A, et al. Measures
of cortical plasticity after transcranial paired associative stimulation predict
changes in electroencephalogram slow-wave activity during subsequent sleep.
J Neurosci 2008;28:7911–18. [39].
[40] Aeschbach D, Cutler AJ, Ronda JM. A role for non-rapid-eye-movement sleep
homeostasis in perceptual learning. J Neurosci 2008;28:2766–72.
[41] Tononi G, Cirelli C. Sleep function and synaptic homeostasis. Sleep Med Rev
2006;10:49–62.
[42] Huber R, Esser SK, Ferrarelli F, Massimini M, Peterson MJ, Tononi G. TMSinduced cortical potentiation during wakefulness locally increases slow wave
activity during sleep. PLoS ONE 2007;2(3).
[43] Massimini M, Ferrarelli F, Esser SK, Riedner BA, Huber R, Murphy M, et al.
Triggering sleep slow waves by transcranial magnetic stimulation. Proc Natl
Acad Sci U S A 2007;104:8496–501.
[44] Vyazovskiy VV, Cirelli C, Pfister-Genskow M, Faraguna U, Tononi G. Molecular
and electrophysiological evidence for net synaptic potentiation in wake and
depression in sleep. Nat Neurosci 2008;11:200–8.
[45] Poe GR, Walsh CM, Bjorness TE. Cognitive neuroscience of sleep. Prog Brain
Res 2010;185:1–19.
[46] Braun AR, Balkin TJ, Wesenten NJ, Carson RE, Varga M, Baldwin P, et al.
Regional cerebral blood fl ow throughout the sleep-wake cycle. An H2 (15)
O PET study. Brain 1997;120:1173–97.
[47] Mobascher A, Arends M, Eschweiler GW, Brinkmeyer J, Agelink MW,
Kornischka J, et al. [Biological correlates of prefrontal activating and
temporoparietal inhibiting treatment with repetitive transcranial magnetic
stimulation (rTMS)]. Fortschr Neurol Psychiatr 2009;77:432–43.
[48] Chauvette S, Seigneur J, Timofeev I. Sleep oscillations in the thalamocortical
system induce long-term neuronal plasticity. Neuron 2012;75(6):1105–13.
[49] Grosmark D, Mizuseki K, Pastalkova E, Diba K, Buzsáki G. REM sleep
reorganizes hippocampal excitability. Neuron 2012;75:1001–7.
[50] Born J, Feld GB. Sleep to upscale, sleep to downscale: balancing homeostasis
and plasticity. Neuron 2012;75(6):933–5.
[51] Feinberg I, Higgins LM, Khaw WY, Campbell IG. The adolescent decline of
NREM delta, an indicator of brain maturation, is linked to age and sex but
not to pubertal stage. Am J Physiol Regul Integr Comp Physiol
2006;291(6):R1724–9.
[52] Campbell IG, Griomm KJ, de Die E, Feinberg I. Sex, poverty, and timing of sleep
EEG measured adolescent brain maturation. Proc Nat Acad Sci USA
2012;109(15):5740–3.
[53] Buchmann A, Ringli M, Kurth S, Schaerer M, Geiger A, Jenni OG, et al. EEG
sleep slow-wave activity as a mirror of cortical maturation. Cereb Cortex
2011;21(3):607–15.
[54] Feinberg I, Campbell IG. Sleep EEG changes during adolescence: an index of
a fundamental brain reorganization. Brain Cogn 2010;72(1):56–65.
[55] Feinberg I, March JD, Fein G, Floyd TC, Walker JM, Price L. Period and amplitude
analysis of 0.5–3 c/sec activity in NREM sleep of young adults.
Electroencephalogr Clin Neurophysiol 1978;44:202–13.
[56] Ringli M, Huber R. Developmental aspects of sleep slow waves: linking sleep,
brain maturation and behavior. Prog Brain Res 2011;193:63–82.
[57] Landolt HP, Borbély AA. Age-dependent changes in sleep EEG topography. Clin
Neurophysiol 2001;112:369–77.
[58] Darchia N, Campbell IG, Tan X, Feinberg I. Kinetics of NREM delta EEG power
density across NREM periods depend on age and on delta-band designation.
Sleep 2007;30:71–9.
[59] Lafortune M, Gagnon JF, Latreille V, Vandewalle G, Martin N, Filipini D, et al.
Reduced slow-wave rebound during daytime recovery sleep in middle-aged
subjects. PLoS ONE 2012;7.
[60] Terzano MG, Parrino L, Smerieri A, Carli F, Nobili L, Donadio S, et al. CAP and
arousals are involved in the homeostatic and ultradian sleep processes. J Sleep
Res 2005;14:359–68.
[61] Halász P, Terzano M, Parrino L, Bódizs R. The nature of arousal in sleep. J Sleep
Res 2004;13(1):1–23.
[62] Blake H, Gerard RW. Brain potentials during sleep. Am J Physiol
1937;119:692–703.
[63] Loomis AL, Harvey EN, Hobart GA. Distribution of disturbance-patterns in the
human electroencephalogram, with special reference to sleep. J Neurophysiol 1939;2:413–30.
[64] Davis H, Davis PA, Loomis AL, Harvey EN, Hobart G. Electrical reactions of
the human brain to auditory stimulation during sleep. J Neurophysiol 1939;2:500.
[65] Colrain IM. The K-complex: a 7-decade history. Sleep 2005;28(2):255–73.
[66] Halász P. K-complex, a reactive EEG graphoelement of NREM sleep: an old
chap in a new garment. Sleep Med Rev 2005;9(5):391–412.
[67] Ujszászi J, Halász P. Long latency evoked potential components in human slow
wave sleep. Electroencephalogr Clin Neurophysiol 1988;69:516–22.
[68] Bastien C, Campbell K. The evoked K-complex: all-or-none phenomenon? Sleep
1992;15:236–45.
[69] Niiyama Y, Satoh N, Kutsuzawa O, Hishikawa Y. Electrophysiological evidence suggesting that sensory stimuli of unknown origin induce spontaneous K-complexes. Electroencephalogr Clin Neurophysiol 1996;98:394–400.
[70] Halász P, Pál I, Rajna P. K-complex formation of the EEG in sleep. A survey
and new examinations. Acta Physiol Hung 1985;65:3–35.
[71] Colrain IM, Webster KE, Hirst G, Campbell KB. The roles of vertex sharp waves
and K-complexes in the generation of N300 in auditory and respiratory related
evoked potentials during early stage 2 NREM sleep. Sleep 2000;23(1):97–106.
[72] Riedner BA, Hulse BK, Murphy MJ, Ferrarelli F, Tononi G. Temporal dynamics
of cortical sources underlying spontaneous and peripherally evoked slow
waves. Prog Brain Res 2011;193:201–18.
[73] Roth M, Shaw J, Green J. The form, voltage distribution and physiological
significance of the K-complex. Electroenceph Clin Neurophysiol 1956;8:385–
402.
[74] Sallinen M, Kaartinen J, Lyytinen H. Precursors of the evoked K-complex in
event-related brain potentials in stage 2 sleep. Electroencephalogr Clin
Neurophysiol 1997;102.
[75] Laurino M, Menicucci D, Piarulli A, Mastorci F, Bedini R, Allegrini P.
Disentangling different functional roles of evoked K-complex components:
mapping the sleeping brain while quenching sensory processing. Submitted
to Neuroimage 2014;86:433–45.
[76] Pampiglione G, Ackner B. The effects of repeated stimuli upon EEG and
vasomotor activity during sleep in man. Brain 1958;81:64–74.
[77] Fruhstorfer H, Partanen J, Lumio J. Vertex sharp waves and heart action during
the onset of sleep. Electroencephalogr Clin Neurophysiol 1971;31:614–17.
[78] Hornyak M, Cejnar M, Elam M, Matousek M, Wallin BG. Sympathetic muscle
nerve activity during sleep in man. Brain 1991;114:1281–95.
[79] Johnson LC, Karpan WE. Autonomic correlates of the spontaneous K-complex.
Psychophysiology 1968;4:444–52.
[80] Sassin JF, Johnson LC. Body motility during sleep and its relation to the
K-complex. Exp Neurol 1968;22:133–44.
[81] Sforza E, Jouny C, Ibanez V. Cardiac activation during arousal in humans:
further evidence for hierarchy in the arousal response. Clin Neurophysiol
2000;111(9):1611–19.
[82] Sforza E, Juony C, Ibanez V. Time-dependent variation in cerebral and
autonomic activity during periodic leg movements in sleep: implications for
arousal mechanisms. Clin Neurophysiol 2002;113:883–91.
[83] Takigawa M, Uchida T, Matsumoto K. Correlation between occurrences of
spontaneous K-complex and the two physiological rhythms of cardiac and
respiratory cycles (author’s transl). Brain Nerve 1980;32:127–33.
[84] Halász P. The role of the non-specific sensory activation in sleep regulation
and in the pathomechanism of generalized epilepsy with generalized spikewave discharge [Doctorial thesis]. Budapest, 1982.
[85] Rajna P, Halász P, Kundra O, Pál I. Event-related non-specific responses
(K-complexes) during sleep. Acta Med Hung 1983;40(1):33–40.
[86] Nicholas CL, Trinder J, Colrain IM. Increased production of evoked and
spontaneous K-complexes following a night of fragmented sleep. Sleep
2002;25(8):882–7.
[87] Bastien C, Campbell K. Effects of rate of tone-pip stimulation on the evoked
K-complex. J Sleep Res 1994;3(2):65–72.
[88] Amzica F, Steriade M. Cellular substrates and laminar profile of sleep
K-complex. Neuroscience 1998;82:671–86.
[89] Cash SS, Halgren E, Dehghani N, Rossetti AO, Thesen T, Wang C, et al. The
human K-complex represents an isolated cortical down-state. Science
2009;324(5930):1084–7.
[90] Crowley K, Trinder J, Colrain IM. An examination of evoked K-complex
amplitude and frequency of occurrence in the elderly. J Sleep Res
2002;11(2):129–40.
[91] Colrain IM, Crowley KE, Nicholas CL, Afifi L, Baker FC, Padilla M, et al. Sleep
evoked delta frequency responses show a linear decline in amplitude across
the adult lifespan. Neurobiol Aging 2010;31(5):874–83.
[92] Colrain IM, Sullivan EV, Rohlfing T, Baker FC, Nicholas CL, Padilla ML,
et al. Independent contributions of cortical gray matter, aging, sex and
alcoholism to K-complex amplitude evoked during sleep. Sleep 2011;34
(6):787–95.
[93] Terzano MG, Mancia D, Salati MR, Costani G, Decembrino A, Parrino L. The
cyclic alternating pattern as a physiologic component of normal NREM sleep.
Sleep 1985;8(2):137–45.
[94] Terzano MG, Parrino L, Boselli M, Smerieri A, Spaggiari MC. CAP components
and EEG synchronization in the first 3 sleep cycles. Clin Neurophysiol
2000;111(2):283–90.
[95] Ferri R, Bruni O, Miano S, Terzano MG. Topographic mapping of the spectral
components of the cyclic alternating pattern (CAP). Sleep Med 2005;6:29–36.
[96] Ferri R, Rundo F, Bruni O, Terzano MG, Stam CJ. Regional scalp EEG slow-wave
synchronization during sleep cyclic alternating pattern A1 subtypes. Neurosci
Lett 2006;404:352–7.
[97] Hirshkowitz M. Arousals and anti-arousals. Sleep Med 2002;3:203–4.
[98] Parrino L, Ferri R, Bruni O, Terzano MG. Cyclic alternating pattern (CAP):
the marker of sleep instability. Sleep Med Rev 2012;16(1):27–45.
[99] Ferri R, Huber R, Aricò D, Drago V, Rundo F, Ghilardi MF, et al. The slow-wave
components of the cyclic alternating pattern (CAP) have a role in sleep-related
learning processes. Neurosci Lett 2008;432(3):228–31.
[100] Aricò D, Drago V, Foster PS, Heilman KM, Williamson J, Ferri R. Effects of NREM
sleep instability on cognitive processing. Sleep Med 2010;11(8):791–8.
[101] Ferri R, Drago V, Aricò D, Bruni O, Remington RW, Stamatakis K, et al. The
effects of experimental sleep fragmentation on cognitive processing. Sleep
Med 2010;11(4):378–85.
[102] Bruni O, Kohler M, Novelli L, Kennedy D, Lushington K, Martin J, et al. The
role of NREM sleep instability in child cognitive performance. Sleep
2012;35(5):649–56.
[103] Novelli L, Ferri R, Bruni O. Sleep cyclic alternating pattern and cognition in
children: a review. Int J Psychophysiol 2013;89(2):246–51.
[104] Marshall L, Helgadóttir H, Mölle M, Born J. Boosting slow oscillations during
sleep potentiates memory. Nature 2006;444:610–13.
[105] Massimini M, Huber R, Ferrarelli F, Hill S, Tononi G. The sleep slow oscillation
as a traveling wave. J Neurosci 2004;24:6862–70.
[106] Entz L, Fabó D, Ero˝ss L, Halász P, Wittner L, Csercsa R, et al. Detection of slow
oscillation detected by cortical electrical stimulation in different vigilance
states in humans. In: Society for Neuroscience, Annual Meeting. San Diego:
2007. p. 723.12.
[107] Ngo HV, Claussen JC, Born J, Mölle M. Induction of slow oscillations by
rhythmic acoustic stimulation. J Sleep Res 2013;22(1):22–31.
[108] Saper CB, Chou TC, Scammell TE. The sleep switch: hypothalamic control of
sleep and wakefulness. Trends Neurosci 2001;24(12):726–31.
[109] Saper CB, Fuller PM, Pedersen NP, Lu J, Scammell TE. Sleep state switching.
Neuron 2010;68(6):1023–42.
[110] Takahashi K, Kayama Y, Lin JS, Sakai K. Locus coeruleus neuronal activity during
the sleepwaking cycle in mice. Neuroscience 2010;169(3):1115–26.
[111] Takahashi K, Lin JS, Sakai K. Characterization and mapping of sleep-waking
specific neurons in the basal forebrain and preoptic hypothalamus in mice.
Neuroscience 2009;161(1):269–92.
[112] Moruzzi G, Magoun HW. Brain stem reticular formation and activation of the
EEG. Electroencephalogr Clin Neurophysiol 1949;1(4):455–73.
[113] McGinty D, Gong H, Suntsova N, Alam MN, Methippara M, Guzman-Marin
R, et al. Sleep-promoting functions of the hypothalamic median preoptic
nucleus: inhibition of arousal systems. Arch Ital Biol 2004;142(4):501–9.
[114] Gallopin T, Fort P, Eggermann E, Cauli B, Luppi PH, Rossier J, et al. Identification
of sleep-promoting neurons in vitro. Nature 2000;404(6781):992–5.
[115] Halász P, Bódizs R. Dynamic structure of NREM sleep. London: Springer; 2012.
[116] McCarley RW, Massaquoi SG. Neurobiological structure of the revised limit
cycle reciprocal interaction model of REM cycle control. J Sleep Res
1992;1(2):132–7.
[117] Lo CC, Chou T, Penzel T, Scammell TE, Strecker RE, Stanley HE, et al. Common
scale-invariant patterns of sleep-wake transitions across mammalian species.
Proc Natl Acad Sci U S A 2004;101:17545–8.
[118] Behn CG, Brown EN, Scammell TE, Kopell NJ. Mathematical model of network
dynamics governing mouse sleep-wake behavior. J Neurophysiol
2007;97(6):3828–40.
[119] McCarley RW, Hobson JA. Neuronal excitability modulation over the sleep
cycle: a structural and mathematical model. Science 1975;189(4196):58–60.
[120] Terzano MG, Parrino L, Fioriti G, Spaggiari MC, Anelli S, Arcelloni T, et al. The
cyclic alternating pattern rate: a sleep variable sensitive to environmental
modifications. A controlled study utilizing white noise and zolpidem. In:
Sauvanet JP, Langer SZ, Morselli PL, editors. Imidazopyridines in sleep
disorders. New York: Raven Press; 1988. p. 219–30.
[121] De Gennaro L, Ferrara M, Spadini V, Curcio G, Cristiani R, Bertini M. The cyclic
alternating pattern decreases as a consequence of total sleep deprivation and
correlates with EEG arousals. Neuropsychobiology 2002;45:95–8.