|
 DOI: 10.1111/j.1365-2788.2010.01354.x DOI: 10.1111/j.1365-2788.2010.01354.x
Authors:
F. Gombos1 R. Bódizs1,2 & I. Kovács1,3
1HAS-BME Cognitive Science Research Group, the Hungarian Academy of Sciences, Budapest, Hungary
2 Institute of Behavioural Sciences, Semmelweis University, Budapest, Hungary
3 Department of Cognitive Science, Budapest University of Technology and Economics, Budapest, Hungary
ABSTRACT
Background Williams syndrome (WS) is a neurodevelopmental genetic disorder characterised by physical abnormalities and a distinctive cognitive profile with intellectual disabilities (IDs) and learning difficulties.
Methods In our study, nine adolescents and young adults with WS and 9 age- and sex-matched typically developing (TD) participants underwent polysomnography. We examined sleep architecture, leg movements and the electroencephalogram (EEG) spectra of specific frequency bands at different scalp locations.
Results We found an atypical,WS characteristic sleep pattern with decreased sleep time, decreased sleep efficiency, increased wake time after sleep onset, increased non-rapid eye movement percentage, increased slow wave sleep, decreased rapid eye movement sleep percentage, increased number of leg movements and irregular sleep cycles. Patients with WS showed an increased delta and slow wave activity and decreased alpha and sigma activity in the spectral analysis of the EEG.
Conclusions Sleep maintenance and organisation are significantly affected in WS, while EEG spectra suggest increases in sleep pressure.
Keywords
developmental disorders, EEG spectra, polysomnography, sleep EEG, sleep stages, Williams syndrome
Introduction
Williams syndrome (WS) is a genetically determined developmental disorder, linked to a microdeletion in chromosome 7q11.23, characterised by distinct facial appearance, cardiovascular abnormalities, mild to moderate ID, learning difficulties, high sociability and empathy (Meyer-Lindenberg et al. 2006). The most interesting characteristic for cognitive research is their distinctive cognitive profile: severe visual-spatial deficits and relative strength in expressive language (Karmiloff-Smith et al. 1997; Bellugi et al. 2000). Overactivity and short attention span is typical in WS. More than 50% of WS individuals are diagnosed with attention deficit hyperactivity disorder (ADHD) (Morris et al. 2000; Leyfer et al. 2006).
Sleep problems are common in developmental disorders, prevalence estimates vary from 13% to 86%, dependent of age, physical and mental impairment and genetic syndrome (Lancioni et al. 1999; Didden & Sigafoos 2001).The few studies that have been published onWS so far do not cover the entire age range, and rely especially on questionnaires. Polysomnography have been used only by a single research group in the past (Arens et al. 1998; Mason et al. 2009). Arens et al. questioned parents of 28 children (mean age 4.7 +/- 2.3 years) withWS in a telephone survey about their sleep habits. Breathing arousal disorder was not diagnosed; however, movement arousal disorder was present in 57% of the cases. Seven of the 16 children with movement arousal sleep disorder and 10 typically developing (TD) participants underwent polysomnography. Children withWS had specific sleep problems, difficulties in initiating sleep, fragmented sleep with long wake periods, as well as periodic limb movements during sleep.They spent more time awake, less time in sleep stages 1 and 2, and more time in stages 3 and 4 than TD participants (Arens et al. 1998). Mason et al. (2009) repeated Arens’ study with more participants.They confirmed the results of the original study with respect to sleep disturbance. Goldman et al. (2009) examined sleep in adolescents and young adults with WS.They used a sleep questionnaire and wrist actigraphy in their study, and found daytime sleepiness prolonged sleep latency, increased wake time, elevated movement index and fragmented sleep.The results support the continuity of sleep problems into adolescence and adulthood; however, studies, looking at sleep architecture by polysomnography in adolescents and adults with WS, are still missing.
Sleep quality is a relevant aspect of the WS phenotype; sleep problems may play an important role in cognitive and attention deficits and learning difficulties. Our main objective was to determine whether alterations in sleep architecture and sleep electroencephalogram (EEG) spectra as measured by polysomnography, similar those that have been found in children by Arens et al. are present in adolescents and adults with WS as well.
Methods
Participants
Nine WS participants were recruited with the help of the Hungarian Williams Syndrome Association and nine age-matched healthy TD participants were recruited by personal contacts. Participants were matched also by sex, with the exception of one twin-pair of different gender, where the male was a WS participant and his healthy fraternal (dizygotic) twin sister was his TD control participant.WS participants (three males and six females) ranged in age from 14 to 28 years, with a mean age of 20.5 +/- 5.5 years and TD participants (two males and seven females) ranged in age from 14 to 29 years, with a mean age of 20.3 +/- 5.3 years. A similarly large age range was used in a study by, e.g. Godbout et al. (2000), and precise age- and gendermatched TD participants were used to overcome this problem.We employed the same precisely matched TD participants in order to deal with the relatively large age range.
Body mass index was in the normal and under the normal range in the WS group (between 13.9 and 26 with an average of 19.4) and in the normal range in the TD group (between 17.4 and 23.3 with an average of 20.5). Fluorescence in situ hybridisation (FISH) test and clinical evaluation confirmed the diagnosis of WS patients. Participants were free of drugs or medications, except for one WS patient who was on stable medication: clonidine (150 mg/ day), enalapril (5 mg/day), acetylsalicylic acid (500 mg/day), betaxololi hydrochloridum (20 mg/ day) and amlodipine (15 mg/day). Exclusion criteria for TD participants were medical diagnosis of sleep problems or psychiatric, neurologic or other medical disorder.The research protocol was approved by the Ethical Committee of the Budapest University of Technology and Economics and all participants or the parents of the underage participants signed informed consent to take part in the experiment.
Recording
Participants underwent two consecutive full-night polysomnography in a sleep laboratory. One parent had the possibility to remain and sleep in the same room on another bed for the whole night. The timing of lights off was determined by the participants, and morning awakenings were spontaneous.
Only the second night was evaluated, the first night supported the adaptation to the conditions. Polysomnographic recordings included 18 EEG channels (Fp1, Fp2, F3, F4, Fz, F7, F8, C3, C4, Cz,T3, T4,T5,T6, P3, P4, O1, O2), scalp electrodes were located using the International 10–20 electrode placement with mathematically linked mastoid reference. Bilateral electrooculograms, bipolarly linked chin electromyogram and electrocardiogram channels were monitored also. Leg movements were monitored with accelerometers over the ankles.We have not recorded respiratory variables because there was no indication for any significant breathing difficulty during sleep in the study by Arens et al. (1998), and in a more recent study by Mason et al. (2009). Moreover, this would have caused further inconveniences for the participants because of the recording instruments. However, one participant, whose sleep was one of the most fragmented in our study, underwent a full-night polysomnography in a clinical sleep laboratory after our examination. The results of clinical respiratory monitoring did not show sleep apnea or hypopnea in this participant. All channels were digitised at a sampling rate of 249 Hz by using the 30 channel Flat Style SLEEP La Mont Headbox with an active 50 Hz notch filter. Signals were high-pass filtered at 0.5 Hz and low-pass filtered at 70 Hz.
Sleep was scored according to the modified Rechtschaffen & Kales methods (Rechtschaffen and Kales 1968; Himanen & Hasan 2000) using 20 s epochs. Periodic leg movements (PLM) in sleep were scored according to standard criteria (American Academy of Sleep Medicine 2005): at least four repetitive episodes of muscle contraction lasting 0.5 to 5 s separated by an interval of 5 to 90 s. PLM index was defined as the number of PLM per hour. A PLM index greater than 5 was considered pathological and called periodic limb movement disorder.
The following definitions were used for sleep architecture evaluation: time in bed (as the time from lights out to final awakening), sleep time (defined as the amount of sleep from sleep onset to final awakening), wake time after sleep onset (WASO, excluding wakefulness after the final awakening), sleep efficiency (calculated as the percent of sleep time without WASO divided by the time in bed), sleep latency (defined as the period between lights off and the first appearance of stage 2 sleep), non-rapid eye movement (NREM), Stage 1 (S1), Stage 2 (S2), slow wave sleep (SWS, defined as the amount of time in Stages 3 and 4), rapid eye movemovement (REM), REM latency (defined as the period between sleep onset and the first epoch scored as REM), number of sleep cycles (number of REM periods separated from each other by more than 15 min), average REM period duration (duration of REM sleep divided by the number of REM periods) and average sleep cycle duration in minutes (sleep time from the sleep onset to the end of the last REM period divided by the number of sleep cycles).
Spectral analyses
After visual artifact rejection, 4 s epochs (50% overlap) from sleep stages 2-3-4 and REM were Hanning-tapered and mixed-radix Fast Fourier Transformed in order to get the average power spectra in NREM and REM. The spectral bins were summed in specific frequency domains to get the band power for the slow oscillation (0.5–1 Hz), as well as delta (1.25–4.5 Hz), slow wave (SWA, 0.75– 4.5 Hz), theta (4.75–7.25 Hz), alpha (7.5–10.75 Hz), sigma (11–15 Hz) and beta (15.25–30 Hz) activities. To standardise absolute power across participants, relative power was also calculated. Relative power was calculated as the ratio of band power to total power. Each channel’s absolute and relative band power was compared between the WS and the TD groups.
Statistical analysis
Statistical analyses of differences in sleep architecture parameters and in power spectra between the WS and the TD participants were performed using the one-way ANOVA test with statistica 8.1 (Statsoft Inc.,Tulsa, OK, USA).
Results
As demonstrated by the representative hypnogram examples of Fig. 1, sleep in WS is more fragmented in general, with more awakenings and less cyclic sleep architecture than in the TD participants.
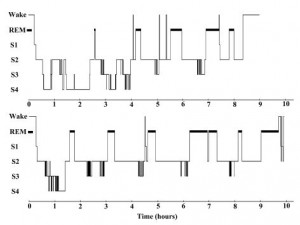
Figure 1 Hypnogram examples. Top: Hypnogram of a 15 years old femaleWilliams syndrome participant. Bottom: Hypnogram of a 14 years old typically developing female participant. REM, rapid eye movement.
Table 1 displays the mean values of sleep architecture variables in patients with WS and TD participants, and also the ANOVA results for group differences. Compared with TD participants,WS participants showed significantly decreased sleep time as well as decreased sleep efficiency.WASO was significantly increased in WS (the group averages being 68.6 min vs. 16.4 min) with larger individual differences in the WS group (SD 52.2 vs. 9.7 min). Sleep latency and REM latency was increased in WS; however, these differences were not significant.WS participants presented a significantly higher amount of NREM sleep percentage and a decreased amount of REM sleep percentage. Increased NREM percentage was mainly because of the increased SWS, there were no differences between the groups in stage 1 and stage 2. Average sleep cycle duration was homogeneous and in the normal range in the TD group (mean 96.2 min, SD 5.9), while among WS participants enormous individual differences were present (mean 98.0, SD 36.7, see Fig. 2).
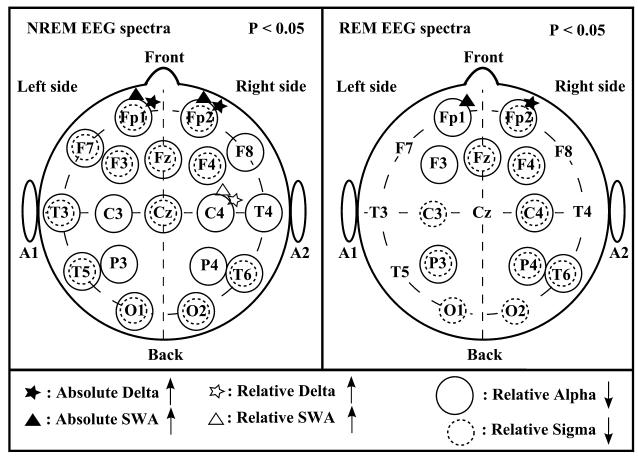
The analysis of leg movements showed a significantly higher number of leg movements per hour in the WS group; however, these leg movements were not periodic.The PLM index was low in both groups, without a significant difference between the two groups.The patterns of significant differences in the sleep EEG spectra of WS and TD participants were similar for the NREM and REM phases, but spatially more extended for NREM and characterised by increases in absolute and relative power of frontopolar (Fp1 and Fp2) delta and SWA, as well as by a region-independent decrease in relative alpha and sigma power (Fig. 3). There were no other power spectra differences between the groups in the examined frequency ranges.
Table 1 Sleep architecture in patients with Williams syndrome and typically developing (TD) participants
Williams syndrome
(n = 9) |
TD participants
(n = 9) |
P |
| Sleep time (min) |
423.9 +/- 113.1 |
530.2 +/- 66.9 |
0.0274* |
| Sleep efficiency (%) |
80.2 +/- 16.8 |
94.4 +/- 2.7 |
0.0233* |
| WASO (min) |
68.6 +/- 52.2 |
16.4 +/- 9.7 |
0.0094** |
| Sleep latency (min) |
28.9 +/- 39.2 |
14.3 +/- 9.3 |
0.2973 |
| NREM (%) |
80.8 +/- 4.3 |
72.4 +/- 4.3 |
0.0007** |
| Stage 1 (%) |
2.2 +/- 1.6 |
1.3 +/- 0.6 |
0.1512 |
| Stage 2 (%) |
53.8 +/- 7.2 |
56.7 +/- 3.3 |
0.2849 |
| SWS (%) |
24.8 +/- 9.5 |
14.4 +/- 4.5 |
0.0085** |
| REM (%) |
19.2 +/- 4.3 |
27.6 +/- 4.3 |
0.0007** |
| REM latency (min) |
138.0 +/- 78.6 |
85.1 +/- 27.5 |
0.0753 |
| LM/hour |
23.4 +/- 12.0 |
14.5 +/- 8.8 |
0.0157* |
| PLM index |
1.8 +/- 2.3 |
1.5 +/- 3.1 |
0.7197 |
| Number of sleep cycles |
4.0 +/- 1.7 |
5.2 +/- 1.1 |
0.0923 |
| Average REM period (min) |
22.7 +/- 9.0 |
28.4 +/- 4.8 |
0.1127 |
| Average sleep cycle (min) |
98.0 +/- 36.7 |
96.2 +/- 5.9 |
0.8869 |
Values are group means +/- SD.
* P < 0.05, ** P < 0.01.
SWS, slow wave sleep;WASO, wake time after sleep onset; LM, leg movements; PLM index, periodic leg movements per hour; NREM, non-rapid eye movement; REM, rapid eye movement.
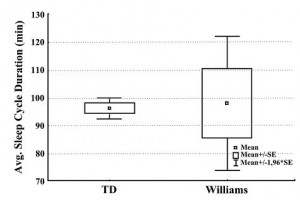
Figure 2 Average (Avg.) sleep cycle duration in the typically developing (TD) (n = 9) and in theWilliams syndrome (WS) (n = 9) groups.

Figure 3 Significant differences in the electroencephalogram (EEG) spectra [stages 2-3-4 and rapid eye movement (REM)] ofWilliams syndrome (WS) (n = 9) and typically developing (TD) (n = 9) participants Left panel: significant differences in the non-rapid eye movement (NREM) EEG spectra. Right panel: significant differences in the REM EEG spectra. Channels labeled with black filled asterisk and triangle indicate increased absolute delta and slow wave activity (SWA) and channels labeled with empty asterisk and triangle indicate increased relative delta and SWA inWS participants as compared with TD participants. Channels labeled with solid circles indicate decreased relative alpha activity and channels labeled with dashed circles indicate decreased relative sigma activity in WS participants as compared with TD participants.
Discussion
In the present study, we proved the continuity of sleep problems in WS into adolescence and adulthood, and found an atypical, WS-characteristic sleep pattern with decreased sleep time, decreased sleep efficiency, increased WASO, increased NREM percentage, increased SWS, decreased REM sleep percentage, irregular sleep cycles and increased number of leg movements.
Difficulties in maintaining sleep and decreased sleep time were found to be characteristic features of our post-pubertal WS sample. This finding is coherent with results of polysomnographic studies on pre-pubertal WS participants (Arens et al. 1998; Mason et al. 2009) and with actigraphic ones on adolescents and adults (Goldman et al. 2009).
Sleep cycles are disconcerted in WS as you can see in the hypnogram examples (Fig. 1) and in the large individual differences in the sleep cycle durations (Fig. 2). There is a possibility that fragmented sleep and frequent awakenings are behind the decreased REM percentage, and an awakening or stage shift occurs before reaching a REM phase during the sleep cycles. However,WS participants have not presented a significantly fewer number of REM periods than TD participants.
Decreased sleep efficiency and decreased REM ratio are characteristic symptoms also in other developmental disabilities like Down syndrome (Diomedi et al. 1999; Miano et al. 2008), autism (Diomedi et al. 1999) and Angelman syndrome (Miano et al. 2004) and in ADHD (Sobanski et al. 2008). ADHD like symptoms are common in the above-mentioned developmental disabilities and in WS as well. Gau et al. (2009) examined ADHD participants and found relationships between sleep problems and ADHD. It is possible that ADHD like symptoms in WS are caused by decreased sleep efficiency and REM percentage. Clonidine, taken by one of our WS participants, may induce changes in dreams. It has been applied in the treatment of nightmares associated with Post-traumatic Stress Disorder (Aurora et al. 2010); however, it could not explain our findings with decreased REM ratio, because the REM sleep ratio of the clonidine treated patient was above the mean REM sleep ratio in the WS group.There is a possibility that decreased sleep efficiency and decreased REM ratio might be improved by treatment, which, in turn, might improve daytime behavior (e.g. attention, learning capacity). Arens et al. (1998) treated WS children with clonazepam, and found fewer and shorter awakenings and less irritability during the day.
Periodic limb movement disorder has been found in WS (Arens et al. 1998) and in Asperger’s syndrome (Godbout et al. 2000) in previous studies. However, we have not observed periodic limb movement disorder. Sleep maintenance was disturbed only by aspecific, non-periodic movement activity.
Williams syndrome participants experience significantly more cognitive overload and fatigue during the day because of their ID, and the difficulty to adapt to their surroundings. It has been shown that fatigue increases the percentage of SWS.
The interpretation of the spectral results is fairly difficult because of the lack of quantitative sleep EEG studies in WS.We found increased delta activity, increased SWA, and decreased alpha and sigma activity in the spectral analysis of the EEG channels in WS participants as compared with TD participants. Delta activity and SWA are dominant in SWS, and their increased presence in the power spectra might be related to the increased ratio of SWS in WS. Sleep spindling and spindle frequency activity were shown to be negative correlates of sleep intensity (delta power), decreasing considerably after periods of extended wakefulness (Dijk 1995). Hence the decrease in sigma activity (covering the usual frequencies of sleep spindling) of our WS participants is coherent with their increased SWS and delta power, providing further potential cues for deeper sleep and/or a homeostatic challenge of the sleep regulation process.The increased delta (in both NREM and REM sleep) as well as the decreased relative NREM sigma activity in the patient group is reminiscent of the effects of sleep deprivation on the EEG and may suggest an elevated sleep propensity in WS (Dijk et al. 1993; Jenni et al. 2005; Marzano et al. 2010). However, alpha power has been shown to covariate with delta and SWA in healthy participants’ NREM sleep (Borbély et al. 1981, Marzano et al. 2010). Therefore, the region-independent decrease of the alpha power in our WS sample is not consistent with overall deeper sleep in WS.
It is also known that SWS percentage and delta EEG power in NREM sleep decrease in typical brain maturation (Feinberg & Campbell 2010). Increased SWS percentage and frontal delta as well as SWA power might be due to either fatigue or delayed brain maturation in WS.The frontopolar localisation of the increased delta power spectra may be related to the increases of grey matter in the frontal lobes (Campbell et al. 2009).
Alternatively, the decreased sigma frequency EEG activity might be a neurophysiologic signature of impaired learning in WS. Sleep spindling has been
shown to be involved in the consolidation of various types of memories, including the visuomotor domain (Tamaki et al. 2008), and a decreased activity might indicate consolidation deficiencies.
Similar alterations in NREM and REM EEG spectra might indicate a more general feature in WS. It might well be that increased SWA and decreased alpha and sigma activity are present in the awake EEG spectra.
Conclusion
We found atypical sleep architecture and altered sleep EEG spectra in WS. Some of these alterations have also been reported in other developmental disorders. Sleep disruption, increased SWS, decreased REM sleep, specificities in the EEG spectra of sleep and leg movements altogether are characteristic features of sleep in WS. Further studies unraveling the relationship between these sleep alterations and daytime symptomatology and learning disabilities in WS are of special interest.
Acknowledgements:This study was supported by the Hungarian National Science Found (OTKA-NF60806 to I.K.).
References
American Academy of Sleep Medicine (2005) International Classification of Sleep Disorders, 2nd Edition: Diagnostic and Coding Manual. American Academy of Sleep Medicine, Westchester, IL.
Arens R., Wright B., Elliott J., Zhao H., Wang P. P., Brown L.W. et al. (1998) Periodic limb movement in sleep in children with Williams syndrome. Journal of Pediatrics 133, 670–4.
Aurora R. N., Zak R. S., Auerbach S. H., Casey K. R., Chowdhuri S., Karippot A. et al. (2010) Best practice guide for the treatment of nightmare disorder in adults. Journal of Clinical Sleep Medicine 6, 389–401.
Bellugi U., Lichtenberger L., Jones W., Lai Z. & St. George M. (2000) The neurocognitive profile of Williams Syndrome: a complex pattern of strengths and weaknesses. Journal of Cognitive Neuroscience 12 (Suppl. 1), 7–29.
Borbély A. A., Baumann F., Brandeis D., Strauch I. & Lehmann D. (1981) Sleep deprivation: effect on sleep stages and EEG power density in man. Electroencephalography and Clinical Neurophysiology 51, 483–95.
Campbell L. E., Daly E., Toal F., Stevens A., Azumaa R., Karmiloff-Smith A. et al. (2009) Brain structural differences associated with the behavioural phenotype in children with Williams syndrome. Brain Research 1258, 96–107.
Didden R. & Sigafoos J. (2001) A review of the nature and treatment of sleep disorders in individuals with developmental disabilities. Research in Developmental Disabilities 22, 255–72.
Dijk D. J. (1995) EEG slow waves and sleep spindles: windows on the sleeping brain. Behavioural Brain Research 69, 109–16.
Dijk D. J., Hayes B. & Czeisler C. A. (1993) Dynamics of electroencephalographic sleep spindles and slow wave activity in men: effect of sleep deprivation. Brain Research 626, 190–9.
Diomedi M., Curatolo P., Scalise A., Placidi F., Caretto F. & Gigli G. L. (1999) Sleep abnormalities in mentally retarded autistic subjects: Down’s syndrome with mental retardation and normal subjects. Brain & Development 21, 548–53.
Feinberg I. & Campbell I. G. (2010) Sleep EEG changes during adolescence: an index of a fundamental brain reorganization. Brain and Cognition 72, 56–65.
Gau S. S. & Chiang H. L. (2009) Sleep problems and disorders among adolescents with persistent and subthreshold attention-deficit/hyperactivity disorders. Sleep 32, 671–9.
Godbout R., Bergeron C., Limoges E., Stip E. & Mottron L. (2000) A laboratory study of sleep in Asperger’s syndrome. Neuroreport 11, 127–30.
Goldman S. E., Malow B. A., Newman K. D., Roof E. & Dykens E. M. (2009) Sleep patterns and daytime sleepiness in adolescents and young adults with Williams syndrome. Journal of Intellectual Disability Research 53, 182–8.
Himanen S. L. & Hasan J. (2000) Limitations of Rechtschaffen and Kales. Sleep Medicine Reviews Rev 4, 149–67.
Jenni O. G., Achermann P. & Carskadon M. A. (2005) Homeostatic sleep regulation in adolescents. Sleep 28, 1446–54.
Karmiloff-Smith A., Grant J., Berthoud I., Davies M., Howlin P. & Udwin O. (1997) Language and Williams Syndrome: how intact is ‘intact’? Child Development 68, 246–62.
Lancioni G. E., O’Reilly M. F. & Basili G. (1999) Review of strategies for treating sleep problems in persons with severe or profound mental retardation or multiple handicaps. American Journal of Mental Retardation 104, 170–86.
Leyfer O.T., Woodruff-Borden J., Klein-Tasman B. P., Fricke J. S. & Mervis C. B. (2006) Prevalence of psychiatric disorders in 4–16-year-olds with Williams syndrome. American Journal of Medical Genetics Part B, Neuropsychiatric Genetics 141B, 615–22.
Marzano C., Ferrara M., Curcio G. & Gennaro L. D. (2010) The effects of sleep deprivation in humans: topographical electroencephalogram changes in non-rapid eye movement (NREM) sleep versus REM sleep. Journal of Sleep Research 19, 260–8.
Mason T., Arens R., Sharman J., Pack A. & Kaplan P. (2009) Polysomnography findings in children with Williams syndrome. Frontiers in Human Neuroscience Conference Abstract: 12th International Professional Conference on Williams Syndrome doi: 10.3389/ conf.neuro.09.2009.07.052.
Meyer-Lindenberg A., Mervis C. B. & Berman K. F. (2006) Neural mechanisms inWilliams syndrome: a unique window to genetic influences on cognition and behaviour. Nature Reviews Neuroscience 7, 380–93.
Miano S., Bruni O., Leuzzi V., Elia M., Verrillo E. & Ferri R. (2004) Sleep polygraphy in Angelman syndrome. Clinical Neurophysiology 115, 938–45.
Miano S., Bruni O., Elia M., Scifo L., Smerieri A., Trovato A. et al. (2008) Sleep phenotypes of intellectual disability: a polysomnographic evaluation in subjects with Down syndrome and Fragile-X syndrome. Clinical Neurophysiology 119, 1242–7.
Morris C. A. & Mervis C. B. (2000) Williams syndrome and related disorders. Annual Review of Genomics and Human Genetics 1, 461–84.
Rechtschaffen A. & Kales A. (1968) A Manual of Standardized Terminology,Techniques and Scoring System for Sleep Stages of Human Subjects. BIS/BRI, University of California at Los Angeles, Los Angeles, CA.
Sobanski E., Schredl M., Kettler N. & Alm B. (2008) Sleep in adults with attention deficit hyperactivity disorder (ADHD) before and during treatment with methylphenidate: a controlled polysomnographic study. Sleep 31, 375–81.
Tamaki M., Matsuoka T., Nittono H. & Hori T. (2008) Fast sleep spindle (13–15 Hz) activity correlates with sleep-dependent improvement in visuomotor performance. Sleep 31, 204–11.
|