|
Institute of Behavioural Sciences, Semmelweis University, Nagyvárad tér 4, H-1089 Budapest, Hungary ∗ Corresponding author. Tel.: +36 1 210 2930×6404; fax: +36 1 210 2953. Received 6 September 2007; received in revised form 9 November 2007; accepted 15 November 2007 Available online 18 December 2007
AbstractThe covert-rapid eye movement (REM) sleep hypothesis of dreaming suggests that elements of REM sleep emerge during sleep onset, leading to vivid hypnagogic imagery. We tested the physiological part of this hypothesis by analysing scalp-recorded electroencephalograms of 15 human subjects during wake-sleep transition and subsequent night time sleep. Wake-sleep transition was categorised semi-automatically as alpha activity, alpha dropout and as early Stage 2 sleep. The slow oscillation, the slow and the fast subdivisions of the delta and the theta frequencies respectively, as well as alpha and sigma bands were analysed. The similarity of individual-specific wake-sleep transition periods and the whole night Stage 2 or REM sleep periods was expressed in a composite similarity measure covering the spectral power of all analysed frequency bands and in frequency-specific similarities related to power values in single bands. A significant increase in composite similarity with the whole night REM sleep emerged in the period of alpha dropout and diminished in early Stage 2 sleep. The alpha dropout period was more similar to whole night REM sleep than to whole night Stage 2 sleep. These region-independent effects were mirrored in region-specific manner by frequency bands of the delta-slow theta range. Findings are in accordance with the covert REM sleep hypothesis, with previous electrocorticographic results and with the frequency range of the sawtooth waves in humans. © 2007 Elsevier Inc. All rights reserved. Keywords: Sleep stages; Polysomnography; Delta rhythm; Theta rhythm; Alpha rhythm; Hypnagogic hallucinations 1. IntroductionWakefulness, non-rapid eye movement (NREM) sleep and rapid eye movement (REM) sleep are naturally occurring states of consciousness, differing substantially in chemical, electrical and metabolic brain processes, as well as in the characteristic subjective experiences accompanying them [9]. Although the core physiological features of these states could explain many of their phenomenological differences, the transition between wakefulness and sleep is still a kind of no mans land, as this poorly characterized period unifies some apparently unrelated features of wakefulness, NREM sleep and REM sleep. On the macrostructural level Stage 1 sleep is regarded as light NREM sleep [15]. Some quantitative EEG analyses revealed a continuous increase in NREM sleep-specific activity during this sleep stage, thus suggesting its NREM sleep-like physiology [4]. However, at the subjective level the transition between wakefulness and sleep is non-continuous, possessing transiently some characteristic features of REM sleep: i.e. vivid and bizarre hallucinatory activity [7], the dream-like quality of which depends on REM sleep pressure [13]. Moreover, frequent episodes of NREM sleep with low muscle tone were detected at sleep onset which may represent early manifestations of REM sleep [18]. However, a functional neuroimaging study concluded that the hypnagogic hallucinatory experience is in fact the dreaming state of wakefulness and not sleep [11]. Detailed EEG analyses of wakefulness–sleep transition (WST) revealed a quite complex picture consisting of nine stages with different electrophysiological features. Almost all of the nine stages could be accompanied by hypnagogic experiences, but the highest incidence was found in the fifth stage, characterized by theta activity appearing after alpha dropout/EEG flattening and before vertex sharp waves/sleep spindling [10]. The question arises if this transitional period shares some EEG features of REM sleep and if yes, what are these features? The covert REM sleep hypothesis of dreaming suggests that hidden REM-like physiological elements appear in different parts of the sleep process determining the concomitant increase in vivid, REM-type mental activity [12]. WST could cover such states. A parahippocampal electrocorticographic analysis of WST in epileptic patients, revealed a transitional increase in REM-like 1.5–3 Hz activity after alpha dropout, before definitive sleep spindling [1]. We hypothesize that there is a transient increase in REM-likeness of the scalp-recorded EEG activity after the alpha dropout period of WST, that is, the pre-spindle EEG shares more similarity with REM sleep than either the previous wakefulness or the subsequent NREM sleep EEG. Moreover, we hypothesize that the EEG of this transitional period is more similar to REM sleep than to Stage 2 sleep EEG. 2. Methods2.1. Subjects and procedures Fifteen healthy subjects free of drugs and medications as assessed by an interview and questionnaires on sleeping habits and health participated in the study (age: 17–55 years, mean: 29.07±10.16 years, eight males and seven females). Subjects were paid volunteers and signed an informed consent. The study was accepted by the Ethical Committee of the Semmelweis University. Sleep was recorded in the sleep laboratory for two consecutive nights. The timing of lights off was determined by subjects’ habit, and the awakenings were spontaneous. Sleep was recorded by standard polysomnography, including electroencephalography (recording sites: Fp1, Fp2, F3, F4, Fz, F7, F8, C3, C4, Cz, P3, P4, T3, T4, T5, T6, O1, O2), left- and right electro-oculography (EOG), bipolar submental electromyography (EMG) and electrocardiography (ECG). EEG electrodes were referred to the contralateral mastoid. We used the right mastoid as a reference for the midline EEG electrodes. Impedances for the EEG electrodes were kept below 5 kΩ. Signals were collect 2.2. EEG analysesWakefulness and sleep stages of the second night recordings were identified manually according to the standardised criteria [15]. Scored recordings were ravelled in 4 s epochs. Epochs containing artefacts were excluded from further analyses. This was done by visual inspection of the EEG, EMG, EOG and ECG signals. Epochs of the WST period were categorised into three substages (Fig. 1): the alpha-dominated state contained 1 min (15 epochs) of visually striking posterior alpha activity in pre-sleep wakefulness (manually-selected baseline) plus the subsequent pre-Stage 2 epochs containing more than 50% alpha activity of baseline (WSTa); the alpha dropout periods contained less than 50% alpha activity of the baseline in the pre-Stage 2 period (WSTs1); the early Stage 2 sleep contained 1 min of NREM Stage 2 sleep from the first visually detectable K-complex or sleep spindle (WSTs2). The selection of epochs containing more or less than 50%of the baseline 1min alpha activity was performed in a derivation-specific manner (each EEG derivations’ pre-Stage 2 epochs were categorised on the basis of that specific channels’ baseline alpha activity). The amount of EEG derivation-specific alpha activity in pre-Stage 2 epochs was determined automatically by fast-Fourier transformation (FFT) as described below.
Epochs of the EEG derivations F3, F4, Fz, C3, C4, Cz, P3, P4, O1, O2, T3 and T4 were Hanning-tapered and zero-padded to 4096 points (16.45 s) then subjected to FFT in order to calculate the average power spectra of the whole night Stage 2 sleep, REM sleep and of the WST substages. The above analyses resulted in periodograms of 0.06 Hz resolution. For purposes of comparability we divided the low frequency EEG bands in subdivisions which closely correspond to those used in a previous study [1]. This was done by finding the closest frequency bin to the frequency limits used in that study. These were the slow oscillation (0.48–1.27 Hz), and the alternating ∼1.25–1.50 Hz wide subdivisions of the delta/theta ranges as follows: Delta-1: 1.51–2.97 Hz; Delta- 2: 3.22–4.49 Hz; Theta-1: 4.74–6.26 Hz; Theta-2: 6.50–7.72 Hz. Additionally alpha (8.02–11.97 Hz) and sigma (12.27–15.01 Hz) bands were also analysed.
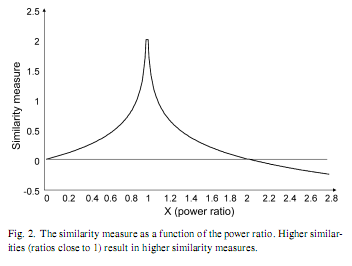
In order to detect the similarities of WST substages with Stage 2 and REM sleep each individuals, each WST power value was divided by the respective value of the REM and Stage 2 sleep power spectra. Resulting ratios (x) were subjected to a data transformation expressing the absolute distance from complete similarity (|1−x|) and inverted (1/|1−x|) to get higher values for higher similarity. As this function is an exponential one it was log-transformed: Similarity measure = log 10(1/|1−x|). Although there was no case of complete similarity (x = 1) in our data, this possibility would cause a problem of division by zero. Therefore we handled this possibility by redefining the function for x values falling between 0.99 and 1.01. Similarity measures for x values in this range were given a constant value of 2.00, which is equal to the output of the similarity formula at x = 0.99 and x = 1.01 (Fig. 2). Data from the 12 recording sites were grouped by averaging the scores from three brain regions: fronto-central: F3, F4, Fz, C3, C4, Cz; parieto-occipital: P3, P4, O1, O2; and temporal: T3, T4. In addition, these frequency-specific regional similarity measures were averaged over frequency bands in order to get a composite measure of similarity in the whole 0.5–15Hz range. Data analysis and transformation was performed with DADiSP 2002 (DSP Development Corp. USA). The similarities of WST substages with Stage 2 sleep and REM sleep were compared by a 3×3×2 ANOVA (Region × WST substage × Stage 2/REM similarity) with repeated measures. The dependent variable was the composite similarity measure. Our hypotheses were tested by the interaction between WST and Stage 2/REM, as well as by specific post-hoc Fisher LSD tests. The latter involved the testing of the transient increase in REM-likeness of the EEG activity during WSTs1 (WSTs1 substages’ similarity with REM higher than WSTa and WSTs2 substages similarity with REM) as well as the testing of the higher resemblance of WSTs1 with REM than with Stage 2 sleep. In a second step we aimed to reveal the main sources of broad-band similarity by differentially analysing the similarity measures that are specific to frequency bands. Here, the dependent variables were the frequency-specific similarities. Statistical analyses were performed with STATISTICA 7.1 (StatSoft Inc, USA). 3. Results
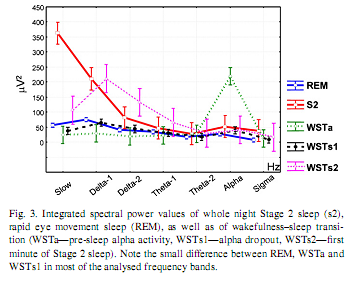
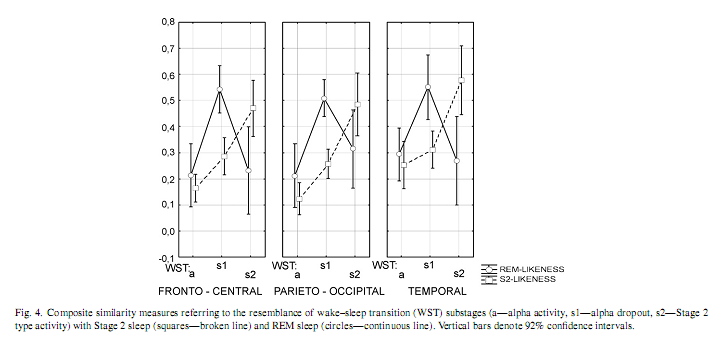
In order to visualize the characteristic differences and similarities between sleep stages and WST substages, centrally (Cz) derived EEG power values were integrated and overplotted in a single graph (Fig. 3). Stage 2 sleep and WSTs2 are characterized by salient activity in the range of the slow oscillation and delta activities (Delta-1 and Delta-2), while WSTa by an increased alpha activity. However, the power values of REM sleep, WSTa substage and WSTs1 substage are similar in all analysed frequency bands, except alpha. 3.2. Composite similarity A significant region effect (F = 11.26; d.f. = 2, 28; p = 0.000258), WST effect (F = 14.39; d.f. = 2, 28; p = 0.00005) and an interaction between WST and Stage 2/REM (F = 10.87; d.f. = 2, 28; p = 0.00032) were observed (Fig. 4). Fisher LSD tests indicated that WSTs1 substages’ similarity to REM is significantly higher than either WSTa substages’ or WSTs2 substages similarity to REM in all regions. WSTs1 substages’ similarity to REM was higher than its similarity with Stage 2 (for all comparisons p≤0.000001).
3.3. Frequency-specific similarities Interactions between WST and Stage 2/REM were detected for the slow oscillation, subdivisions of delta activity, the Theta-1 frequency range and the sigma bands (Table 1). Bold numbers in Table 1 are those significant probabilities showing a higher REM-like EEG activity of WSTs1 as compared with WSTa (columns s1–a) and WSTs2 (columns s1–s2). The significant differences between WSTs1 substages’ similarity to Stage 2 sleep and WSTs1 substages’ similarity to REM sleep are indicated by bold numbers in columns s1–s1 (Comp. s2- and REM-likeness). The transient increase in REM sleep-like EEG activity is supported if columns s1–a and s1–s2 indicate significant differences. This transient REM-like activity is superior to Stage 2-like activity if columns s1–s1 indicates a significant difference. All three comparisons have to be significant in order to obtain a statistical su
These findings indicate that no single frequency band mimicked the trend of the composite measure of similarity (the transient and exclusive WSTs1-specific increase in similarity with REM sleep in all regions). However, the behaviour of frequency bands in the delta-slow theta range followed this trend in a region-specific manner: Delta-1 activity in fronto-central and parieto-occipital regions, as well as Delta-2 and Theta-1 activities in the fronto-central region (Table 1). 4. DiscussionOur aim was to give a quantitative EEG support for the hypothesis that WST covers some electrophysiological elements which are common to REM sleep. This is a central concept of the covert REM sleep hypothesis of dreaming, which suggests that vivid, dream-like imagery emerging during WST develops on a REM-like physiological basis [12]. As there is increasing evidence for individual variability in sleep EEG [6,5,3,19], we performed our analysis by an individual adjustment of WST data with Stage 2 and REM sleep EEG derived from the same recording night. Our analyses largely supported our hypotheses and the notion that there is a regular increase in REM-like EEG activity after alpha dropout, just before definitive sleep spindling. The similarity of that periods’ EEG activity to REM sleep EEG surpasses its resemblance to Stage 2 sleep. Moreover, this increase in similarity to the REM sleep EEG seems to be a wide-band EEG feature, because the composite measure derived from all subdivisions of the 0.48–15.01 Hz frequency bands showed the clearest effects in all regions. Thus, the composite measure of similarity with REM sleep is more reliable than the individual subdivisions of it, suggesting that no specific frequency band, but a larger part of the frequency spectrum is involved in the shaping this similarity. The transient increase in REM-like human parahippocampal 1.5–3 Hz activity during the period of EEG alpha dropout, just before definitive sleep spindling [1] suggests that the present results are part of a global process which is not confined to neocortical activity. There is no unequivocal physiological explanation for the electroencephalographic similarity between Stage 1 and REM sleep. Current neurophysiological theories of sleep emphasize thalamocortical disfacilitation caused by lowering brainstem acetylcholine release during the initiation of sleep [16], which is a NREM sleep-like process. However, one cannot exclude the possibility that the thalamic disfacilitation precedes the deactivation of basal forebrain arousal centres, the latter being the main sources of REM sleep-like cortical activation [2]. As we did not awaken our subjects and hence did not collect mentation reports during WST, we cannot explicitly claim that the resemblance of WSTs1 with REM sleep is the main factor triggering dream-like mental activity at sleep onset. However, there is indirect evidence for this suggestion, as empirical studies indicate an association of sleep onset mental activity with delta [8] and theta [10] EEG waves. This coheres with our current finding that delta and low theta activity is the salient part of similarity between the period of alpha dropout and REM sleep. Although the relative lack of delta- and slow theta EEG activities in both Stage 1 and REM sleep may contribute to our present findings [17], it is important to note that the characteristic frequency (1.5–5 Hz) of REM sawtooth waves [14,17] is in close correspondence with the frequency range mentioned in the scoring criteria to identify Stage 1: mixed frequency EEG with a prominence of activity in the 2–7Hz range [15]. Conflict of interestThe authors declare no conflict of interest. AcknowledgementsThis work was supported by the National Office for Research and Technology (NKFP-1B/020/04) and the National Research Fund (OTKATS-049785 and OTKAT-048927). The first author is supported by the János Bolyai Research Fellowship of the Hungarian Academy of Sciences. References[1] R. Bódizs, M. Sverteczki, A.S. Lázár, P. Halász, Human parahippocampal activity: non-REM and REM elements in wake–sleep transition, Brain Res. Bull. 65 (2005) 169–176. [2] A.R. Braun, T.J. Balkin, N.J. Wesenten, R.E. Carson, M. Varga, P. Baldwin, S. Selbie, G. Belenky, P. Herscovitch, Regional cerebral blood flow throughout the sleep-wake cycle. An H2(15)OPET study, Brain 120 (1997) 1173–1197. [3] J. Buckelmüller, H.P. Landolt, H.H. Stassen, P. Achermann, Trait-like individual differences in the human sleep electroencephalogram, Neuroscience 138 (2006) 351–356. [4] L. DeGennaro, M. Ferrara, M. Bertini, The boundary between wakefulness and sleep: quantitative electroencephalographic changes during the sleep onset period, Neuroscience 107 (2001) 1–11. [5] L. De Gennaro, M. Ferrara, F. Vecchio, G. Curcio, M. Bertini, An electroencephalographic fingerprint of human sleep, Neuroimage 26 (2005) 114–122. [6] L.A. Finelli, P. Achermann, A.A. Borbély, Individual ‘fingerprints’ in human sleep EEG topography, Neuropsychopharmacology 25 (2001) S57–S62. [7] D. Foulkes, G. Vogel, Mental activity at sleep onset, J. Abnorm. Psychol. 70 (1965) 231–243. [8] A. Germain, T.A. Nielsen, EEG power associated with early sleep onset images differing in sensory content, Sleep Res. Online 4 (2001) 83–90. [9] J.A. Hobson, E.F. Pace-Schott, R. Stickgold, Dreaming and the brain: toward a cognitive neuroscience of conscious states, Behav. Brain Sci. 23 (2000) 793–842. [10] T. Hori, M. Hayashi, T. Morikawa, Topographical EEG changes and the hypnagogic experience, in: R.D. Ogilvie, J.R. Hansh (Eds.), Sleep Onset: Normal and Abnormal Processes, American Psychological Association, Washington, DC, 1994, pp. 237–253. [11] T.W. Kjaer, I. Law, G. Wiltschiotz, O.B. Paulson, P.L. Madsen, Regional cerebral blood flow during light sleep—a H215O-PET study, J. Sleep Res. 11 (2002) 201–207. [12] T.A. Nielsen, Mentation in REM and NREM sleep: a review and possible reconciliation of two models, Behav. Brain Sci. 23 (2000) 851–866. [13] T. Nielsen, P. Stenstrom, T. Takeuchi, S. Saucier, J. Lara-Carrasco, E. Solomonova, E. Martel, Partial REM-sleep deprivation increases the dream-like quality of mentation from REM-sleep and sleep onset, Sleep 28 (2005) 1083–1089. [14] P.L. Pearl, B.J. LaFleur, S.C. Reigle, A.S. Rich, A.A. Freeman, C. McCutchen, S. Sato, Sawtooth wave density analysis during REM sleep in normal volunteers, Sleep Med. 3 (2002) 255–258. [15] A. Rechtschaffen, A. Kales (Eds.), A Manual of Standardized Terminology, Techniques and Scoring System for Sleep Stages of Human Subjects, UCLA, Brain Information Service, Los Angeles, 1968. [16] M. Steriade, Corticothalamic resonance, states of vigilance and mentation, Neuroscience 101 (2000) 243–276. [17] M. Takahara, S. Kanayama, H. Nittono, T. Hori, REM sleep EEG pattern: examination by a new EEG scoring system for REM sleep period, Sleep Biol. Rhythms 4 (2006) 105–110. [18] G. Tinguely, R. Huber, A.A. Borbély, P. Achermann, Non-rapid eye movement sleep with low muscle tone as a marker of rapid eye movement sleep regulation, BMC Neurosci. 7 (2006) 2. [19] A.M. Tucker, D.F. D
|


 3.1. Spectral power
