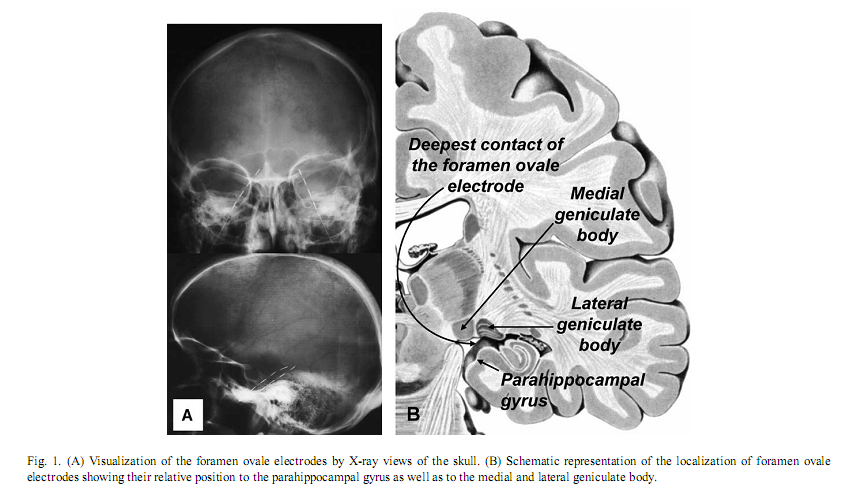
Authors:Róbert Bódizs a, ∗, Melinda Sverteczki a, Alpár Sándor Lázár a, Péter Halászb a Institute of Behavioural Sciences, Semmelweis University, Nagyvárad tér 4, H-1089 Budapest, Hungary *Corresponding author. Tel.: +36 1 2102930/6404; fax: +36 1 2102955. E-mail address: bodrob@net.sote.hu (R. Bódizs). Received 1 October 2004; accepted 6 January 2005 AbstractThe covert-rapid-eye-movement (REM) sleep hypothesis of dreaming suggests that elements of REM sleep emerge during sleep onset, leading to vivid hypnagogic imagery. Based on parahippocampal electrocorticography of epileptic patients we found an increase in REM-like 1.5–3.0 Hz parahippocampal activity during wake-sleep transition, which peaks after on average 30 s of sleep onset, and reaches 82% of REM sleep value. The increase in 1.5–3.0 Hz parahippocampal activity followed alpha dropout, but did not relate to short-term fluctuations in alpha waves or sleep spindles. Non-REM sleep-specific slow (<1.25 Hz) activity showed a continuous increase during wake-sleep transition in both temporal scalp and parahippocampal recordings. It is suggested that REM-like parahippocampal rhythmic slow activity is an after-effect of hypothalamic wake-promoting centers’ switch-off at sleep onset, leading to an inhibited hippocampal functioning and hypnagogic hallucinations. Keywords: Electroencephalography; Hippocampal formation; Theta rhythm; Alpha rhythm; Cortical synchronization; Hypnagogic hallucinations 1. IntroductionThe neurobiological basis and the phenomenological aspects of wakeful consciousness, non-rapid-eye-movement (NREM) sleep and rapid-eye-movement (REM) sleep are becoming increasingly clarified [13]. The transition between wakefulness and sleep is characterized by an abrupt change in consciousness, usually accompanied by hypnagogic hallucinations, which are bizarre and vivid like REM sleep dreams [18], but less well understood in physiological terms. Wakefulness-sleep transitions were investigated by mentation reports, as well as with electrophysiological and functional neuroimaging methods [8,18]. In spite of the major scientific efforts it is still unknown whether stage-1 sleep is actually sleep or some kind of mixture between wakefulness and sleep. Regarding EEG activity, there is a continuous transition between wakefulness and stage-2 sleep, and the EEG-features of NREM sleep evolve gradually during this transitional period [8]. However, the subjective experience of hypnagogic hallucinations cannot be explained by NREM sleep initiation processes, because these kinds of vivid sensory experiences are not characteristics of NREM sleep mentation. Vivid hypnagogic imagery owns some of the features of REM sleep dreaming. The similarity between stage-1 and REM sleep EEG has been being obvious since the early time of REM sleep discovery when REM sleep was called emergent stage-1 sleep. Although REM bursts are usually absent during stage-1 sleep, there are slow eye movements occurring occasionally prior to the appearance of sleep spindles [9]. However, stage-1 sleep differs from REM sleep by the maintained muscular tone, absent in REM sleep. Although sleep-onset REM phase emergence had been primarily associated with pathological conditions such as narcolepsy and major depression, the rate of its occurrence in non-pathologic population was found to be relatively high, reaching 17% [2]. The covert-REM sleep hypothesis of dreaming [18] suggests that “hidden” REM sleep features are present during sleep onset, explaining the vivid hypnagogic imagery. Slow eye movements, occurring also in REM sleep, exemplify these “hidden” features. The similarities of the scalp-recorded EEGs of the two states are also called into attention by this theory, but clearly we do not have enough data about the possible similarities and differences between the period of sleep onset and REM sleep. The only functional neuroimaging study examining stage-1 sleep reported occipital lobe blood flow increase as well as cerebellar, posterior parietal, right premotor and left thalamic flow decreases during this transitional state. As functional neuroimaging studies of REM sleep show a different picture, authors speculate that REM sleep and stage-1 sleep are qualitatively different in a way that REM sleep reflects the dreaming state of the unaware, sleeping brain, while stage-1 sleep represents the dreaming state of wakefulness [15]. However, no differences were observed between light sleep with and without subjective experiences and the authors themselves hypothesize that the relatively coarse measure of H215O PET is unable to detect subtle differences in brain activity. Traditional EEG recording techniques are characterized by low spatial resolution, hence, their ability to measure activity of the hidden surfaces of the brain is limited. In turn modern functional neuroimaging techniques have excellent spatial resolution; however, their temporal resolution to detect subtle state changes in the transition from wakefulness to sleep is still low [17]. Intracranial EEG or electrocorticography provides a tool for bridging the gap between these two levels of analysis. By measuring the electrical activity generated by much smaller neuronal networks, electrocorticographic recordings allow the observation of brain signals that would be invisible at the scalp [14]. Although there is a controversy regarding the frequency of REM sleep-dependent rhythmic hippocampal slow activity in humans [5,26], parahippocampal–hippocampal structures show characteristic and sleep-state specific activity patterns [4,7,25]. A distinct 1.5–3.0 Hz synchronized parahippocampal activity was observed in REM sleep, which did not occur in NREM sleep and wakefulness [4]. Similar delta activity of the human thalamic medial pulvinar nucleus during REM sleep was reported recently [16]. However, other studies reported theta-frequency (4–7 Hz) activity [7] as well as alpha/beta-frequency (10–20 Hz) activity [25], both measured over the parahippocampal gyrus and hypothesized to be the human counterparts of hippocampal theta waves originally described in rodents. As hippocampal rhythmic slow Measuring the activity of the parahippocampal-hippocampal structures could be useful in delineating the unknown features of the state transition from wakefulness to sleep. Neither electrocorticography nor the invasive deep cortical recording techniques were used before in the analysis of the transition from wakefulness to sleep. The covert-REM sleep hypothesis of dreaming would suggest that a REM-like activity evolves during sleep onset at the time of alpha dropout and this activity persists in the initial part of stage-2 sleep. Since there is neuropsychological evidence for the lack of hippocampal involvement in hypnagogic imagery [24], the analysis of parahippocampal-hippocampal activity during wakefulness-sleep transition is of special interest. Moreover, the inactivity of hippocampal episodic memory system seems to be a common feature of hypnagogic imagery and REM sleep dreams [23]. By using monopolar foramen ovale recording technique in epileptic patients, we hypothesize that the previously described REM sleep-dependent 1.5–3.0 Hz activity increases during sleep onset, correlates with alpha dropout and persists in the initial part of stage-2 sleep. 2. Materials and methodsFrom 13 epileptic patients undergoing pre-surgical evaluation with foramen ovale electrodes, 8 were selected in this study. Selection criterion was a smooth transition between wakefulness and sleep (i.e. without transient awakenings and movements during the period of 5 min before and 4 min after the first sleep spindle or K-complex). Foramen ovale electrodes are flexible wires introduced through the foramen ovale into the cisterna ambiens during general anesthesia [27]. They contact the parahippocampal gyrus at four points bilaterally along the axis of the hippocampal formation (Fig. 1A). The deepest contact of the foramen ovale electrode is close to the lateral geniculate body [28] (Fig. 1B). This kind of mesio-temporal corticography provides a unique opportunity to measure parahippocampal population activity in a semi-invasive way, without opening the skull. Foramen ovale electrodes contained four silver contacts (length: 5 mm), each 5 mm apart. All patients gave written informed consent for the implantation of the electrodes and for participation in the study. Additional electrodes of the 10–20 system and standard polysomnography were used to define sleep stages according to standard criteria [19]. Parallel scalp recordings of the 10–20 system, electrooculography, submental electromyography, and electrocardiography were performed with Ag/AgCl electrodes fixed with collodium. X-rays of the skull determined the location of the FO electrodes (Fig. 1A). Signals from all electrodes were cutoff filtered at 0.33 Hz, amplified and digitized at 128 Hz with 12-bit resolution. The timing of lights off was determined by the patients at will. Each night’s recording from lights off to spontaneous awakening was stored on removable disks of 100 MB capacity. Nine minutes long records containing the last 5 min before and the first 4 min after the first visually detected scalp-EEG spindle or K-complex were selected. Temporal evolution of the slow oscillation (0.25–1.25 Hz) and of alternating 1.25–1.50 Hz wide subdivisions of the most purposeful delta/theta-frequency range (1.5–3.0, 3.25–4.50, 4.75–6.25, 6.50–7.75 Hz), as well as of alpha (8–12 Hz), sigma (12.25–15.00 Hz) and beta (15.25–30.00 Hz) activity were assessed by Fast Fourier Transformation (FFT) of consecutive 4 s epochs (50% overlap, Hanning window). The usefulness of these frequency bands was evidenced by both visual and quantitative EEG analysis in a previous report [4]. Although we calculated both absolute and relative power of parahippocampal activity patterns, we based our conclusion primarily on relative power of these subdivisions of the delta/theta-frequency bands, because these had been shown to reliably differentiate between sleep stages [4]. Power values of adjacent four epochs (10 s) were averaged. An additional smoothing procedure namely a three points moving average was performed. We selected 30–50 artifact- and spike-free 4 s epochs from tonic REM sleep and normalized the 1.5–3.0 Hz relative power of the parahippocampal wakefulness-sleep transition signal by expressing it as a percent of the individual 1.5–3.0 Hz relative power of tonic REM sleep. A parahippocampal channel from those which are contralateral to the ictal pacemaker and least affected by interictal spikes, as well as the frontal (F3 or F4), temporal (T3 or T4) and occipital (O1 or O2) channels of the same side (all vertex-referred) were selected for analysis. In those cases in which bitemporal epilepsy was diagnosed we chose the least affected parahippocampal channel for analysis. Temporal evolution of power values were averaged between subjects and fitted by a least squares fifth order polynomial. Additionally, we compare the wakefulness-sleep transition period with more stable states of consciousness. Thirty to fifty 4 s epochs free of artifacts and spikes, dominated by alpha waves or stage-2 sleep, but outside of the wakefulness-sleep transition period were selected and analyzed by FFT. Moreover, epochs of the wakefulness–sleep transition period were visually categorized as alpha, alpha dropout and spindle/stage-2 states. Comparison of different states was performed by t-test for dependent samples.
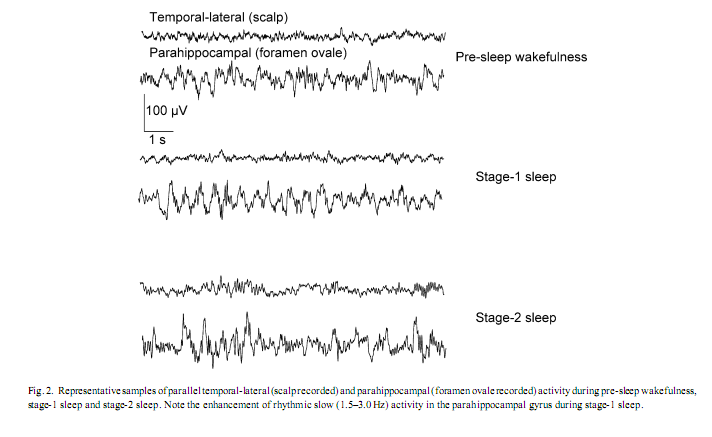
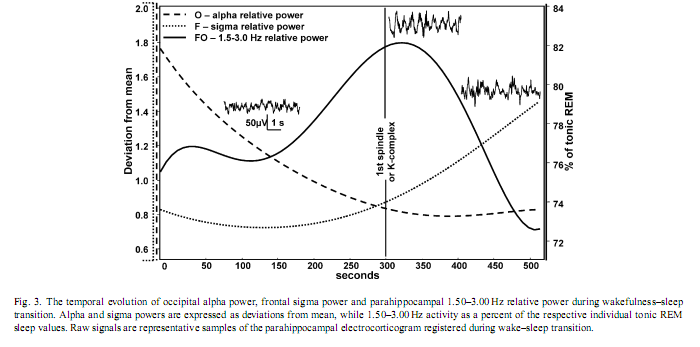
3. ResultsVisual inspection of the parahippocampal records revealed periods characterized by transient enhancement of rhythmic activity around 2 Hz, usually occurring around the first scalp EEG signs of sleep, most frequently during polygraphically defined stage-1 sleep (Fig. 2). Occipital alpha and frontal sigma power showed a falling and rising trend, respectively, while the evolution of 1.5–3.0 Hz parahippocampal activity showed a slightly skewed, bell-shaped curve. The peak of the latter fell between the periods of alpha and sigma dominance on average 30 s after the first sleep spindle or K-complex was observed and it reached 82% of tonic REM sleep values (Fig. 3). Skewness resulted from the slower increase of 1.5–3.0 Hz activity during the period of alpha dropout.
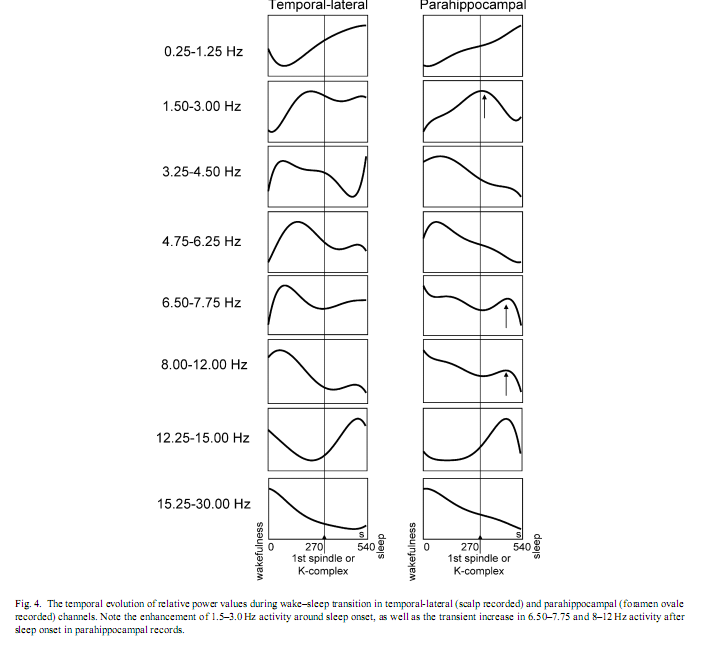
Subject by subject cross-correlational analysis of occipital relative alpha power and parahippocampal 1.5–3.0 Hz REM-like activity (based on power trends smoothed by three points moving average procedures) revealed negative correlations in three cases (r = −.51, −.43 and −.37 with p-v The comparison of temporal-lateral (scalp) and parahippocampal (foramen ovale) channels yielded striking similarities in the temporal evolution of the relative predominance of some EEG activities (Fig. 4). These similarities include the 0.25–1.25 Hz activity, which increased linearly during wake–sleep transition, low- and mid-theta activities (3.25–4.50 and 4.75–6.25 Hz), which peaked shortly before sleep onset, as well as alpha (8–12 Hz) and beta (15.25–30.00 Hz) activities, which were at their highest level already at the beginning of the period analysed and decreased during the transitional period. Similarly sigma activity (12.25–15.00 Hz) reached its maximum after sleep onset in both temporal-lateral and parahippocampal channels. However, a few differences between temporal-lateral and parahippocampal activities were observed. The 1.5–3.0 Hz activity peaked shortly after sleep onset only in parahippocampal records. Additionally, high-theta (6.50–7.75 Hz) and alpha (8–12 Hz) activities showed a transitional increase after sleep onset in parahippocampal records, which was not observed in temporal-lateral derivations.
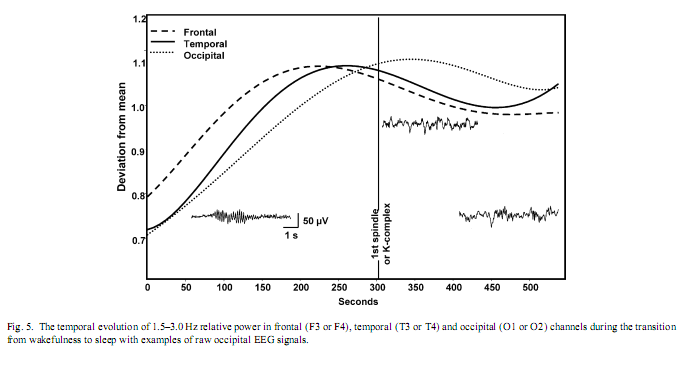
In a next step, those frequency bands which showed a transient increase during and/or after sleep onset in parahippocampal recordings (1.5–3.0, 6.50–7.75, 8–12 Hz) were tested for their specificity to stable states of pre-sleep wakefulness, stage-2 sleep or tonic REM sleep. Relative power of 1.5–3.0 Hz parahippocampal activity was significantly higher in tonic REM sleep than in stable pre-sleep wakefulness (t = 2.90; p = .02) or in stage-2 sleep (t = 2.87; p = .02).Wakefulness and stage-2 sleep did not differ significantly with respect to 1.5–3.0 Hz relative power (t = 1.13; p = .29). In contrast, relative power of parahippocampally measured 6.50–7.75 Hz activity was not specific for any of the three analyzed states, in other words comparison of wakefulness with stage-2 sleep, wakefulness with tonic REM sleep or stage-2 sleep with tonic REM sleep did not reveal significant differences (t = 1.58, 2.00 and 0.48 with p = .15, .08 and .64, respectively). Relative power of 8–12 Hz activity in parahippocampal recordings was significantly higher in stable pre-sleep wakefulness than either in stage-2 sleep (t = 3.16; p = .01) or tonic REM sleep (t = 3.68; p = .007). Stage-2 sleep and tonic REM sleep did not differ significantly with respect to the relative power of 8–12 Hz activity (t = 0.97; p = .36). Absolute power values of all frequency bands except that of alpha and beta increased in all channels during the wakefulness-sleep transition. Absolute alpha and absolute beta power decreased. No other frequency band showed a bell shaped curve peaking shortly after the middle of the transitional period observed in 1.5–3.0 Hz relative power of the parahippocampal electrocorticogram. Indeed scalp-EEG recorded 1.5–3.0 Hz relative power showed similar, but less consistent peaks in all three channels (Fig. 5). There was an anterio-posterior gradient in the time of peaking: frontal 1.5–3.0 Hz relative power peaked earlier than temporal and temporal earlier than occipital. The latter resembled considerably the parahippocampal REM-like activity trend (see also [4]).
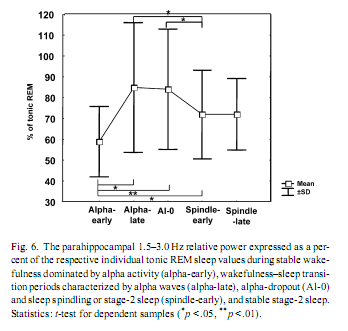
The individually normalized 1.5–3.0 Hz relative power during stable wakefulness (alpha-early) was significantly lower than throughout any other transitional state, including the alpha-dominated epochs (alpha-late). However, it did not differ significantly from stable stage-2 sleep (spindle-late). Alpha-dominated transitional periods (alpha-late) and alpha- dropout transitional periods (alpha-0) did not differ significantly, but both of them showed higher 1.5–3.0 Hz activity than early-spindling (Fig. 6). 4. DiscussionIt must be noted that the findings reported here were obtained on epileptic patients and epilepsy could affect EEG-oscillations. In previous electrocorticographic studies of sleep [4,3,7,25], the elimination of epileptic activity was made by visual selection. But the complete avoidance of epileptic spikes was not possible in this study. Such elimination would cause a data loss and a breakdown of continuity in the analysis of wake-sleep transition. However, the temporal evolution of absolute power values in our study is in accordance with findings of EEG-studies focusing on sleep onset of non-epileptic persons [8]: slow (< 8 Hz) and sigma (12.25–15.00 Hz) activities gradually increased, while fast (15.25–30.00 Hz) activity decreased during wake–sleep transition. This suggests that basic EEG phenomena of wake-sleep transition were not modified by epilepsy in our patients. But unlike absolute power values, the relative power of EEG activities showed a more differentiated picture of the wake-sleep transition. Both temporal-lateral and parahippocampal relative power of frequency band 0.25–1.25 Hz showed a gradual increase (Fig. 4). The predominance of < 1.25 Hz activity was shown to be a common feature of temporal-lateral and parahippocampal EEG during NREM sleep [4]. This frequency range corresponds to the slow oscillation of cortical origin [22], and its temporal evolution observed here is in accordance with the enhancement of the synchronization of the slow oscillation with the deepening of sleep [1]. Results concerning the transient increase of 1.5–3.0 Hz parahippocampal activity during wake–sleep transition confirmed our hypothesis. Relative power of 1.5–3.0 Hz parahippocampal activity was shown to be specific for REM sleep. REM-like 1.5–3.0 Hz parahippocampal activity increased during the transition from wakefulness to sleep, reaching an average of 82% of tonic REM just shortly after the first electrophysiological signs of sleep (Fig. 3). Similar, but less pronounced phenomena were observed in scalp EEG derivations (Fig. 5). Although the increase in 1.5–3.0 Hz parahippocampal activity followed occipital alpha dropout on the whole (Fig. 3), short-term fluctuations in alpha power (e.g. alpha bursts) and REM-like parahippocampal slow activity correlated only in a subset of patients. Negative correlation between alpha activity and REM-like 1.5–3.0 Hz parahippocampal activity was observed in three of eight patients while positive correlation in just one patient. Given the recent interest in decreased alpha activity as a marker of dream recall [10], more research is needed in order to elucidate the relationship between alpha activity and parahippocampal slow activity. It seems that simply approaching sleep onset per se has a 1.5–3.0 Hz REM-like parahippocampal activity-inducing property, but the parallelism between 1.5 and 3.0 Hz parahippocampal activity and alpha decrease is less than perfect and probably modulated by other as yet unknown factors. There is recent evidence for an increased delta activity during REM sleep in the human medial thalamic pulvinar nucleus [16]. Given the fact that the deepest contact of the foramen ovale electrodes are close to the lateral geniculate body of the thalamus [28] (Fig. 1B) the possible thalamic origin of 1.5–3.0 Hz activity cannot be entirely excluded. However, the thalamic origin of 1.5–3.0 Hz activity would not dispro Relative theta activity peaks shortly before the onset of stage-2 sleep (i.e. first sleep spindle or K-complex). This holds for both temporal-lateral and parahippocampal records (Fig. 4) and it is in accordance with the notion that theta activity is an EEG marker of enhanced sleep pressure in humans [11]. However, parahippocampal high-theta (6.50–7.75 Hz) and alpha (8–12 Hz) activity transiently increased following sleep onset (Fig. 4). This could mean that sleep-related neural synchronizations involve different frequency components in temporal-lateral and parahippocampal regions. However, unlike 1.5–3.0 Hz activity, 6.50–7.75 and 8–12 Hz activity are not specific for REM sleep. Consequently, the transient increase of these frequency components after sleep onset could not be interpreted as signs of REM sleep. The REM-like 1.5–3.0 Hz parahippocampal activity observed during wakefulness-sleep transition in this study supports the covert-REM sleep hypothesis of dreaming [18]. The two sleep states accompanied by the most vivid imagery (sleep onset and REM sleep) are characterized by a similar parahippocampal slow activity pattern. The most probable origin of this parahippocampal activity could be the hippocampal rhythmic slow oscillation [4]. The consistently low hippocampal output during rhythmic slow activity [6] would suggest the lack of hippocampal involvement in hypnagogic imagery as well as in REM sleep dreaming. Evidence for this hypothesis was gathered by eliciting mentation reports during wake-sleep transition in patients suffering from hippocampal damage [24]. Another possibility is that the most vivid hypnagogic dreaming occurs in the early portion of sleep onset (during the increase in parahippocampal activity) but can still be recalled much later in the sleep onset sequence—even when hippocampal output is low (perhaps because the imagery is so vivid). Hippocampal rhythmic slow activity was shown to appear as a rebound-like after-effect following the termination of arousing hypothalamic stimulation in cats [12]. Thus, the possibility exists that similar phenomena emerge during wakefulness-sleep transition, when wake-promoting hypothalamic arousal systems switch off [21]. The transient enhancement of rhythmic hippocampal slow activity could be a REM-like physiological process during wake-sleep transition, as well as a neurophysiological correlate of bizarre hypnagogic imagery, in accordance with the covert-REM sleep hypothesis of dreaming [18]. AcknowledgementThis research was supported by the European Sleep Research Grant 2002 of the ESRS–Sanofi-Synthelabo Group. References[1] F. Amzica, M. Steriade, Coalescence of sleep rhythms and their chronology in corticothalamic networks, Sleep Res. Online 1 (1998) 1–10. [2] C. Bishop, L. Rosenthal, T. Helmus, T. Roehrs, T. Roth, The frequency of multiple sleep onset REM periods among subjects with no excessive daytime sleepiness, Sleep 19 (1996) 727–730. [3] R. Bódizs, M. Békésy, A. Szűcs, P. Barsi, P. Halász, Sleep-dependent hippocampal slow activity correlates with waking memory performance in humans, Neurobiol. Learn. Mem. 78 (2002) 441–457. [4] R. Bódizs, S. Kántor, G. Szabó, A. Szűcs, L. Erőss, P. Halász, Rhythmic hippocampal slow oscillation characterizes REM sleep in humans, Hippocampus 11 (2001) 747–753. [5] R. Bódizs, A. Szűcs, P. Halász, Does hippocampal theta exist in the human brain? (Comment to the paper of Uchida et al. 2001 with the response of the authors), Neurobiol. Sleep–Wakefulness Cycle 1 (2001) 102–105. [6] G. Buzsáki, The hippocampo-neocortical dialogue, Cereb. Cortex 6 (1996) 81–92. [7] J.L. Cantero, M. Atienza, R. Stickgold, M.J. Kahana, J.R. Madsen, B. Kocsis, Sleep-dependent theta oscillations in the human hippocampus and neocortex, J. Neurosci. 23 (2003) 10897–10903. [8] L. De Gennaro, M. Ferrara, M. Bertini, The boundary between wakefulness and sleep: quantitative electroencephalographic changes during the sleep onset period, Neuroscience 107 (2001) 1–11. [9] L. De Gennaro, M. Ferrara, F. Ferlazzo, M. Bertini, Slow eye movements and EEG power spectra during wake-sleep transition, Clin. Neurophysiol. 111 (2000) 2107–2115. [10] M.J. Esposito, T.A. Nielsen, T. Paquette, Reduced alpha power associated with the recall of mentation from stage 2 and Stage REM sleep, Psychophysiology 41 (2004) 288–297. [11] L.A. Finelli, H. Baumann, A.A. Borbély, P. Achermann, Dual electroencephalogram markers of human sleep homeostasis: correlation between theta activity in waking and slow-wave activity in sleep, Neuroscience 101 (2000) 523–529. [12] E. Grastyán, G. Karmos, L. Vereczkey, E.E. Kellényi, The hippocampal electrical correlates of the homeostatic regulation of motivation, Electroencephalogr. Clin. Neurophysiol. 21 (1966) 34–53. [13] J.A. Hobson, E.F. Pace-Schott, R. Stickgold, Dreaming and the brain: toward a cognitive neuroscience of conscious states, Behav. Brain Sci. 23 (2000) 793–842. [14] M.J. Kahana, D. Seelig, J.R. Madsen, Theta returns, Curr. Opin. Neurobiol. 11 (2001) 739–744. [15] T.W. Kjaer, I. Law, G. Wiltschiotz, O.B. Paulson, P.L. Madsen, Regional cerebral blood flow during light sleep—a H2 15O-PET study, J. Sleep Res. 11 (2002) 201–207. [16] M. Magnin, H. Bastuji, L. Garcia-Larrea, F. Mauguiere, Human thalamic medial pulvinar nucleus is not activated during paradoxical sleep, Cereb. Cortex 14 (2004) 858–862. [17] P. Maquet, Functional neuroimaging of normal human sleep by positron emission tomography, J. Sleep Res. 9 (2000) 207–231. [18] T.A. Nielsen, Mentation in REM and NREM sleep: a review and possible reconciliation of two models, Behav. Brain Sci. 23 (2000) 851–866. [19] A. Rechtschaffen, A. Kales (Eds.), A Manual of Standardized Terminology, Techniques and Scoring System for Sleep Stages of Human Subjects, UCLA, Brain Information Service, Los Angeles, 1968. [20] T.E. Robinson, Hippocampal rhythmic slow activity (RSA; theta): a critical analysis of selected studies and discussion of possible species-differences, Brain Res. 203 (1980) 69–101. [21] C.B. Saper, T.C. Chou, T.E. Scammel, The sleep switch: hypothalamic control of sleep and wakefulness, Trends Neurosci. 24 (2001) 726–731. [22] M. Steriade, A. Nunez, F. Amzica, A novel slow (< 1 Hz) oscillation of neocortical neurons in vivo: depolarizing and hyperpolarizing components, J. Neurosci. 13 (1993) 3252–3265. [23] R. Stickgold, J.A. Hobson, R. Fosse, M. Fosse, Sleep, learning, and dreams: off-line memory reprocessing, Science 294 (2001) 1052–1057. [24] R. Stickgold, A. Malia, D. Maguire, D. Roddenberry, M. O’Connor, Replaying the game: hypnagogic images in normals and amnesics, Science 290 (2000) 350–353. [25] S. Uchida, T. Maehara, N. Hirai, Y. Okubo, H. Shimizu, Cortical oscillations in human medial temporal lobe during wakefulness and all-night sleep, Brain Res. 891 (2001) 7–19. [26] S. Uchida, M. Nishida, N. Hirai, F. Miwakeichi, Does hippocampal theta exists in the human brain? Neurobiol. Sleep–Wakefulness Cycle 1 (2001) 1–8. [27] H.G. Wieser, C.E. Elger, S.R.G. Stodieck, The ‘foramen ovale electrode’: a new recording method for the preoperative evaluation of patients suffer [28] H.G. Wieser, U. Schwarz, Topography of foramen ovale electrodes by 3D image reconstruction, Clin. Neurophysiol. 112 (2001) 2053–2056.
|