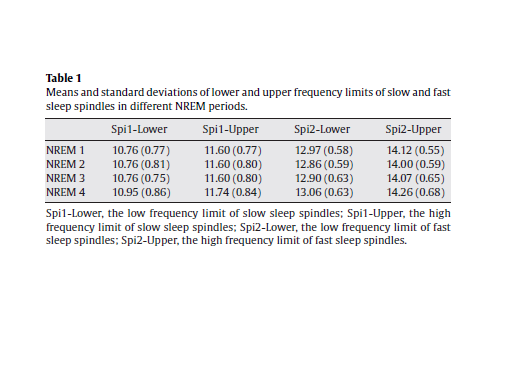
3. Results3.1. The frequency of slow- and fast sleep spindlesBased on the procedure described above (Section 2.2) we determined the individualized frequency limits for slow- and fast sleep spindles in NREM periods 1–4. Results are presented in Table 1. In general slow spindles were slower than 12 Hz, while fast spindles were faster than 12.5 Hz. However, this cannot be considered a rule, as there were subjects with slow spindle frequencies between 12.15 and 13.26 Hz or subjects with fast spindle frequencies between 11.76 and 12.84 Hz for example. In the following we present results of the calculations with the individually adjusted frequency and amplitude criteria of slow- and fast sleep spindles.
3.2. Topography, sleep cycle- and age effects
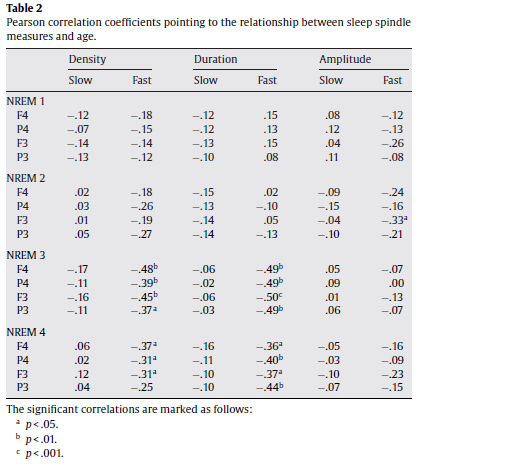
In order to test our first hypothesis we analyzed the effects of sleep cycles and age on the density, duration andamplitude of slow and fast sleep spindles separately. Sleep spindle density (number of spindles per minutes of NREM sleep) was analyzed in a repeated measures analysis of variance (ANOVA) model involving the following within-subjects factors: sleep cycle (1–4), sleep spindle type (slow and fast), hemisphere (right, left), and topography (frontal and parietal). A significant main effect of the hemisphere factor (F = 8.79; d.f. = 1,37; p = .005267) revealed an overall higher spindle density in the left EEG channels (F3 and P3). Significant interaction between the hemisphere and spindle type factors (F = 9.30; d.f. = 1, 37; p = .00422) showed that primarily the fast type of sleep spindles were characterized by a left hemispheric dominance.1 The main effect of the topography factor revealed an overall higher spindle density over the parietal regions, as compared to the frontal ones (F = 59.42; d.f. = 1, 37; p < .000001). Topography interacted with spindle type (F = 121.13; d.f. = 1, 37; p .05 for all combinations), the difference between the first and the fourth sleep cycle regarding the parietally measured fast sleep spindle density proved to be significant. This was also true for the difference between the first and third as well as the first and fourth sleep cycles regardin g the frontally measured slow sleep spindle density (Fig. 2). These results suggest a slight increasing trend in the density of the parietally measured fast sleep spindles and the opposite in the frontally measured slow ones. As regarding age effects, fast but not slow spindle density correlated negatively with age in cycle 3 and 4 (Table 2). The same statistical model was applied for the analysis of spindle duration. A significant main effect of the hemisphere (F = 8.04; d.f. = 1, 37; p = .007358) as well as its interaction with spindle type (F = 6.75; d.f. = 1, 37; p = .013326) revealed the pattern already described for spindle density: fast sleep spindle duration showed a consistent hemispheric asymmetry with a left hemispheric dominance. Overall spindle duration was higher in parietal derivations as compared to the frontal ones (F = 5.86; d.f. = 1, 37; p = .02042). As in the case of spindle density this effect was accompanied by an interaction between topography and spindle type (F = 111.13; d.f. = 1, 37; p < .000001), which according to post hoc Tukey HSD tests pointed to higher fast sleep spindle durations in parietal as compared to frontal derivations (p = .000167) as well as to a reverse topographic pattern in slow spindle durations (p = .000168). However, there was longer lasting slow than fast spindles in both frontal (p = .000167) and parietal (p = .000167) derivations. Thus, unlike density duration of spindles varied as a function of their type (see Fig. 3): slow spindles were significantly longer lasting than fast ones (F = 27.53; d.f. = 1, 37; p = .000007). No significant main effects of sleep cycles emerged (F = 2.12; d.f. = 3, 111; p = .10096) for spindle duration. However, we observed an interaction between sleep cycles and topography (F = 4.19; d.f. = 3, 111; p = .007) denoting longer lasting parietal than frontal spindles during the fourth sleep cycle (p = .0259). The post hoc analysis of spindle duration according to sleep cycles, topography and spindle type revealed a decrease of slow spindle durations in cycle three and a significant increase in cycle four (both compared to cycle 1). This was true for both frontal and parietal derivations (Fig. 3). The increase in fast sleep spindle duration began from the third sleep cycle and was found in the parietal derivations only (Fig. 3). Spindle duration behaved like spindle density in terms of age effects: the mean duration of fast but not slow spindles in cycles 3 and 4 correlated negatively with age (Table 2).
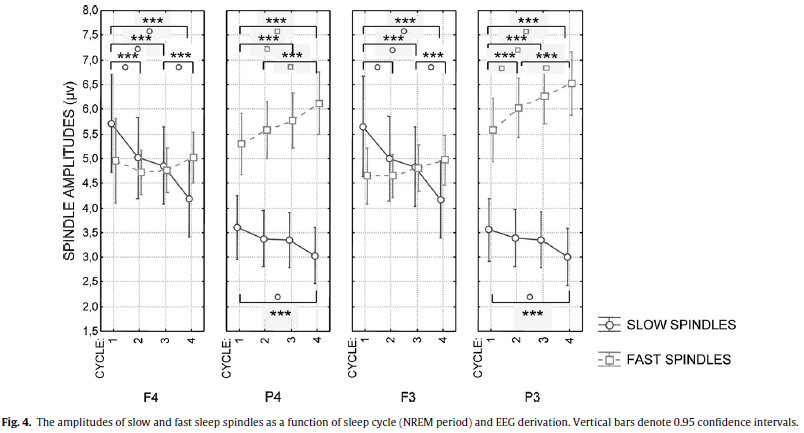
As spindle amplitude is determined in the filtered raw EEG and as such is a derivation-dependent measure (in contrast with spindle density and duration which are insensitive to the reference electrode) hemispheric differences were not included in our next analysis. Here a cycle (1–4) × spindle type (slow − fast) × EEG derivation (F4, P4, F3, P3) model of repeated measures ANOVA served as a way of analyzing the amplitudes of sleep spindles. Additionally, only the derivations with the same reference electrodes were compared (that is F3 with P3 and F4 with P4). A significant main effect of spindle type (F = 16.01; d.f. = 1, 37; p = .00029) indicated higher amplitudes for fast spindles (Fig. 4).
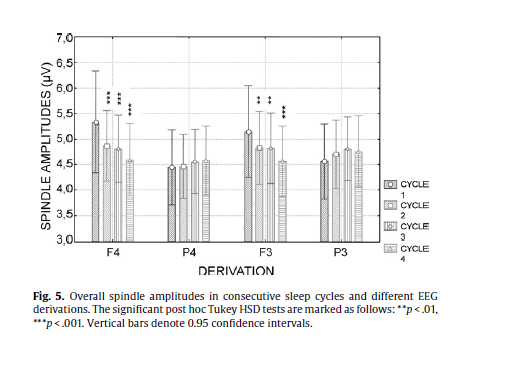
The interaction of the factor spindle type with the factor sleep cycle (F = 5.97; d.f. = 3, 111; p = .00082) showed that the difference in the amplitudes of slow and fast sleep spindles are not present in the first cycle and increase gradually across the consecutive sleep cycles (p = .0037, .00019, and .00011 for the second, third and fourth cycles, respectively, according to the Tukey HSD post hoc tests). Slow spindle amplitude showed a linearly decreasing trend across consecutive sleep cycles. When considering the first sleep cycle as a baseline the decrease reached significance in the fourth cycle (p = .0043). The spindle type factor presented significant interaction with the derivation factor (F = 182.81; d.f. = 3, 111; p < .000001) as well, showing no difference in slow and fast spindle amplitudes at the recording sites F3 and F4, and a significant difference at P3 (p = .000118) and P4 (p = .000118). Derivation had also a main effect on spindle amplitudes (F = 5.06; d.f. = 3, 111; p = .00251) which meant an overall higher spindle amplitude in derivation F4 in comparison with derivation P4 (p = .0027) while the latter was characterized by lower spindle amplitudes than derivation F3 (p = .016). Derivation interacted with the factor sleep cycles (F = 12.23; d.f. = 9, 333; p < .00001), which pointed to a decrease in spindle amplitudes over consecutive sleep cycles in the frontal but not in the parietal derivations (Fig. 5). Although the interaction between sleep cycles, derivation and spindle type was not significant (F = 1.08; d.f. = 9, 333; p = .37) post hoc Tukey HSD tests revealed a decreasing trend in frontal slow spindle amplitudes and an increasing trend in parietal fast sleep spindle amplitudes over consecutive sleep cycles (see Fig. 4 for details). In contrast with spindle density and duration no significant correlations between sleep spindle amplitudes and age emerged (Table 2).
3.3. Comparison of automatic spindle detection with visual scoring
In total 2140 sleep spindles were identified by visual scoring. This value refers to both channels. Automatic detection identified 4780 sleep spindles. 92.9 percent of the visually detected spindles were matched by the IAM and 7.1 percent were not. In contrast 41.59 of sleep spindles detected by the IAM were matched by visual scoring, while 58.41 of IAM spindles were not. Additionally, we report the overlap of visually and IAM-detected spindle periods. Visually detected spindles covered 7.36 and 11.7% of the whole scored EEG periods in channels F4 and P4, respectively. The corresponding values for IAM were 24.55 and 32.13. The 83.78 and 87.47% of visually detected spindle periods were congruous with the IAM spindle periods in channels F4 and P4, respectively. In contrast only 39.83 and 56.12% of IAM spindle periods were congruous with visual ones. In order to further improve the direct comparison of our automatic and visual scoring of sleep spindling we correlated the numbers and densities (spindles/min) of IAM and visual spindles. This was performed on the merged dataset of EEG derivations F4 and P4. Both the number and the density of IAM spindles correlated positively with the number and the density of visually scored spindles (r = .45; p < .024 and r = .41; p = .044 for number and density, respectively).
In our second hypothesiswe claimed that the spectral content of the sleep EEG segments covered by the IAM of sleep spindle analysis mirrors the individual-specific shape of the average spectra with increased values at the peaks reflecting sleep spindles. The parallelism between the average amplitude spectra of the whole analyzed segment (AVG), the spectra of automatically and visually detected spindles (A&VD), exclusively automatically detected (EAD) spindles, exclusively visually detected (EVD) spindles and segments with no detections (ND) was tested by calculating Pearson correlation coefficients in the frequency range of 9–16Hz (for an example of different spectra see Fig. 6). At the EEG derivation F4 the correlations between A&VD and AVG (mean r = .87) as well as between EAD and AVG (mean r = .95) amplitude spectra were significantly higher than the correlations between EVD and AVG (mean r = .58; t = 2.89, p = .0145 and t = 3.46, p = .0053, respectively) or ND and AVG (mean r = .48; t = 2.68, p = .021 and t = 3.83, p = .0027, respectively) spectra (Fig. 7). Similar results emerged at derivation P4. Here the mean correlation of A&VD and EAD with AVG were .80 and .95, respectively, which significantly exceeded the correlation of EVD (mean r = .45; t = 3.29, p = .0071 and t = 5.24, p = .0002) and ND (mean r = .38; t = 2.34, p = .039 and t = 4.27, p = .0013, see also Fig. 7) with AVG. In addition the correlation between EAD spectra and AVG spectra was higher than the correlation between A&VD and AVG in derivation F4 (t = 2.40, p = .035). Given the above mentioned high similarity of A&VD and EAD spectra with AVG spectra one might wonder if A&VD and EAD contain some specific elements in comparison with AVG. To reject the null hypothesis (A&VD and EAD did not differ from AVG) we compared the integrated amplitude spectra of A&VD, EAD, EVD, ND and AVG in the individual-specific spindle ranges (slow+ fast) by repeated measures ANOVA with the factors segment (A&VD, EAD,EVD, ND, and AVG) and topography (F4, P4). This resulted in a significant main effect of segment (F = 24.99; d.f. = 4, 44; p < .000001), without a significant effect of topography (F = 0.93; d.f. = 1, 11; p = .35) or interaction between segment and topography (F = 1.51; d.f. = 4, 44; p = .21). Given the lack of the effect of topography post hoc Tukey HSD tests were used for testing the segment effects only (with the collapsed data of derivations F4 and P4). Individualspecific spindle spectra of A&VD, EAD and EVD were significantly higher than the spindle spectra of ND and AVG (Fig. 8). 4. DiscussionThe accurate analysis of sleep spindling has remarkable practical and theoretical importance. This is underlined by the reported cognitive (Bódizs et al., 2005, 2008; Clemens et al., 2005, 2006; Schabus et al., 2007, 2008; Fogel et al., 2007) and clinical neuropsychiatric (Donnet et al., 1992; Ferrarelli et al., 2007; Petit et al., 2004; Limoges et al., 2005; Gürses et al., 2005) correlates of different sleep spindle measures. Given the high interindividual variability of sleep spindle spectra (Werth et al., 1997; De Gennaro et al., 2005; Buckelmüller et al., 2006) we aimed to take into consideration this variability and to individually adjust the frequency and amplitude criteria of spindle analysis to the individual-specific features. This was done in order to avoid the splitting of individual spectral peaks by using ad hoc frequency criteria. In a previous publication (Bódizs et al., 2005) we developed the first version of our method in order to assess the relationship between sleep spindling and general mental ability. Though this first study supported the significance of separating slow- and fast sleep spindles, yet it also suffered from some methodological drawbacks. These were the ad hoc amplitude correction of the filtered signal and the lack of information on the duration and the amplitude of sleep spindles, which were shown to be important when investigating cognitive correlates (Schabus et al., 2007). In our present report we worked out these shortcomings by using an alternate method of bandpass-filtering and envelope detection. Moreover, we provided an extensive characterization of the output of the IAM by analyzing sleep cycle and age effects, topographical differences and a comparison with visual sleep spindle scoring. Our approach was based on the notion of the individual fingerprints in sleep EEG spectra (De Gennaro et al., 2005; Buckelmüller et al., 2006). In our concept this should be the basis and at the same time the final test of sleep spindle analysis. An accurate automatic method of sleep spindle quantification should recognize spindles which are characterized by the individual-specific features observed in the EEG spectra. The visual detection of spindles is just a method of catching the typical and well-formed spindles, which – according to our present results – may contribute to the individual-specific spectral peaks, but represent just the cube of the iceberg. The IAM was based on this theoretical background and the procedure detected much more sleep spindles than previous methods (see Fig. 2). It is important to note however, that slow- and fast sleep spindle densities are not additive because a given spindle sequence might contain both slow- and fast frequency components. A merge of IAM slow- and fast sleep spindle detections in the subsample used for the comparison of IAM with the visual detection resulted in an average spindle density of 11 spindles/min/derivations. Given this high value it is important to show that the visually nondetected IAM spindles (EAD) share the individual-specific spectral shape exceeding the average in the individual-specific spindle ranges. These statements were supported by the exceptionally high and significant correlations between EAD spectra and AVG spectra (see Figs. 6 and 7) and the difference between integrated spindle spectra of EAD and AVG (Fig. 8). EVD spectra were characterized by much lower similarity with AVG than the EAD spectra (Fig. 7). That means that those 7.1 percent of visually detected sleep spindles which were not covered by IAM (EVD) are characterized by a non-specific spectral content, which does not resemble the AVG of the individual. Whether these spindles should be measured by some additional improved methodology or discarded in cognitive and clinical studies is a question which merits further attention. The correlations between the numbers and densities of visually detected and IAM spindles were positive and significant, but relatively low. Thus the individual differences in the level of sleep spindling might be predicted by both the IAM and the visual detection, but the similarity of these predictions is only of about 20%. In our opinion the positive and significant correlations suggest the common backgrounds of the visually detected and the IAM spindles, but there might be an imperfect association between the variance in the inclusiveness of the two methods. Reasons for this imperfect association might be related to the differences between the features potentially influencing human pattern recognition and automatic detection based on the IAM. The former could be influenced by the presence of non-spindle frequency components or by the shape of the analyzed signal, while the latter is sensitive to the individual-specific spectral content only. Thus the inclusiveness of visual spindle detection might be more deeply influenced by factors like the shape of the actual spindle waveform or the presence of frequency components outside of the usual sigma range, while the IAM is practically unaffected by these intuitive features. However, one should ascertain, that we miss unequivocal data regarding the practical relevance of non-sigma frequency components embedded in the spindle sequences or of the shape of spindles. The IAM is based on the fingerprint theory of sleep EEG (De Gennaro et al.2005; Buckelmüller et al., 2006) which considers the average spectra only and is not related to the above mentioned, visually striking spindle features. The IAM of sleep spindle analysis resulted in slow- and fast sleep spindle detections which were preponderant in frontal and parietal derivations, respectively (Fig. 2). The similar, but less accentuated topographical patterns of spindle durations and spindle amplitudes were observed. Here we reported relatively increased levels of frontal and parietal slow spindling and fast spindling, respectively, but differences between the two types of spindling in the same topographic area did not follow the rule (Figs. 3 and 4). There is a large number of evidence underscoring the anterior predominance of slow and posterior predominance of fast sleep spindle measures (Gibbs and Gibbs, 1950; Zeitlhofer et al., 1997; Werth et al., 1997; Anderer et al., 2001). Our current results cohere with these data providing an enrichment of the existing data with the observation that it is spindle occurrence (density) which is the main source of the topographical difference, with spindle duration and spindle amplitude contributing much less to this effect. As we did not found a significant effect for the sleep cycles in our results the IAM did not unequivocally reproduced the sleep-cycle-dependent decline in slow spindle frequency activity and the concomitant increase in fast sleep spindle frequency activity (Werth et al., 1997). Although, we reported significant differences between the first and the third or the first and the fourth sleep cycles in spindle density and duration (Figs. 2 and 3), these results cannot be considered vicarious with the hypothesized main effects or interaction effects of cycles with other factors. The only well established sleep cycle effect is the sleep cycle-dependent decrease in frontal sleep spindle amplitude (Fig. 5) which might cohere with the sleep-cycle-dependent decline in slow spindle frequency activity (Werth et al., 1997). The herein reported effect of age on sleep spindling suggests that the fast but not the slow sleep spindle densities and durations measured in the third and in the fourth sleep cycle decrease with age. As the frequency of IAM fast spindles was 12.5–14 Hz in general (Table 1), our above results cohere with the finding of Landolt et al. (1996) who reported an age-dependent decrease in sleep spindle frequency activity, which is particularly enhanced in the third and in the fourth sleep cycle and restricted to the 12.25–14 Hz band. In our data we also observed a left hemispheric predominance of fast sleep spindle density and duration, which – at least to our knowledge – was never reported in the literature. However, a similar pattern of hemispheric asymmetry is known to be characteristic for sleep-deprivation-induced EEG delta enhancement in humans. The latter was interpreted as a case of local sleep regulation reflecting the functional asymmetry between the dominant and non-dominant hemisphere (Achermann et al., 2001). Given the shared mechanisms of spindle and delta production (Steriade, 2003) it is reasonable to assume a similar role for spindle asymmetry, which could be the reflection of local corticothalamic functionality (Bódizs et al., 2008). It is obvious that the IAM detects a relatively high number and long periods of wave episodes which do not possess the typical spindle-like shape. No other current method of spindle analysis would term these episodes as spindles. As this particularly high number and long periods of IAM spindle detections which were not considered spindles during the visual inspection could be interpreted as a very high percent of false positives we have to be cautious in interpreting the present results. A powerful method should be sensitive and accurate at the same time. Thus the possibility exists that our method is just inadequate for sleep spindle analysis. This statement is true if we consider visual inspection as a final test of validity. But is visual inspection a reliable method? We think that its reliability is based on the consensus theory of truth. Bare consensus may serve the function of a reference point for the discussion of alternative theories. Such alternative theories may start out from new empirical findings. Such findings might be the two types of sleep spindles (Schabus et al., 2007) and the genetic basis of the individual fingerprints of NREM sleep EEG spectra in the spindle range (De Gennaro et al., 2008). Indeed visual sleep spindle scoring was never proved to be reliable in the differential analysis of slow- and fast sleep spindles or in the unraveling of the individual fingerprints of sleep EEG spectra. However, one should consider that the IAM spindles contribute to the peaks in the spectrum, which are regarded as the fingerprints of sleep-EEG and spectral measures of spindles. The classic measures of spindle frequency activity derived from spectral power of the spindle frequency range are even more inclusive than IAM. The classic spectral measures cover not only the spectral peaks, but also the pink noise contribution of no-spindle intervals as well as the power spectra around and between the peaks. In our consideration these approaches are overly inclu sive while the classical spindle detection methods which are tight to visual detection too exclusive. Moreover, neither is sensitive to the individual differences in frequency, forcing the EEG signal into the Procust bed of some predefined frequency limits. |
 and cortical region. The overall interaction between cycles, topography and spindle type is not significant. The significant post hoc Tukey HSD tests are marked as follows: *p < .05, **p < .01, ***p </p> <table border=")
 and cortical region. The overall interaction between cycles, topography and spindle type is not significant. The significant post hoc Tukey HSD tests are marked as follows: *p < .05, **p </p> <h4>3.2. Topography, sleep cycle- and age effects</h4> <p>In order to test our first hypothesis we analyzed the effects of sleep cycles and age on the density, duration and amplitude of slowand fast sleep spindles separately.</p> <p><img class=")
, while automatic detection is more sensitive to the hidden and less emphatic features.")
 expressing the parallelism of 9–16 Hz amplitude spectra of different EEG segments with the average amplitude spectra of all segments. A&VD, automatic and visual detections; EAD, exclusively automatic detectio
ns; EVD, exclusively visual detections; ND, no detections; AVG, average. The significant dependent sample t-tests are marked as follows: *p < .05, **p < .01, ***p </p> <p>In our second hypothesis we claimed that the spectral content of the sleep EEG segments covered by the IAM of sleep spindle analysis mirrors the individual-specific shape of the average spectra with increased values at the peaks reflecting sleep spindles. The parallelism between the average amplitude spectra of the whole analyzed segment (AVG), the spectra of automatically and visually detected spindles (A&VD), exclusively automatically detected (EAD) spindles, exclusively visually detected (EVD) spindles and segments with no detections (ND) was tested by calculating Pearson correlation coefficients in the frequency range of 9–16 Hz (for an example of different spectra see Fig. 6). At the EEG derivation F4 the correlations between A&VD and AVG (mean r = .87) as well as between EAD and AVG (mean r = .95) amplitude spectra were significantly higher than the correlations between EVD and AVG (mean r = .58; t = 2.89, p = .0145 and t = 3.46, p = .0053, respectively) or ND and AVG (mean r = .48; t = 2.68, p = .021 and t = 3.83, p = .0027, respectively) spectra (Fig. 7). Similar results emerged at derivation P4. Here the mean correlation of A&VD and EAD with AVG were .80 and .95, respectively, which significantly exceeded the correlation of EVD (mean r = .45; t = 3.29, p = .0071 and t = 5.24, p = .0002) and ND (mean r = .38; t = 2.34, p = .039 and t = 4.27, p = .0013, see also Fig. 7) with AVG. In addition the correlation between EAD spectra and AVG spectra was higher than the correlation between A&VD and AVG in derivation F4 (t = 2.40, p = .035).</p> <p><img class=")