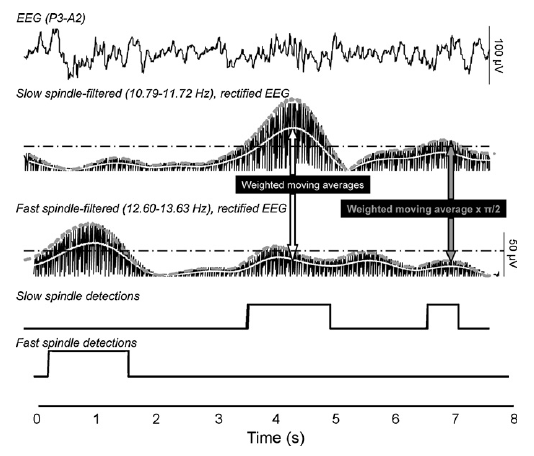
2. Methods2.1. Subjects and proceduresPolysomnographic recordings of 46 adult subjects (29 men and 17 women; mean age: 32.46 years; age range: 17–55) participating in two different research projects were used as a database for the current research. The research protocols were approved by the Ethical Committee of the Institute of Behavioural Sciences Semmelweis University Budapest. All subjects signed informed consent for the participation in the studies. According to a semi-structured interview subjects were healthy and free of any current drug effects including contraceptives. Small and habitual doses of nicotine and caffeine, but not alcohol were allowed. Results of the Edinburgh Handedness Inventory revealed 41 right-handed, three left-handed and two ambidextrous subjects in our database. The timing of lights off was determined by subjects’ habit, and the awakenings were spontaneous. Sleep was recorded for two consecutive nights by standard polysomnography, including electroencephalography (recording sites: Fp1, Fp2, F3, F4, Fz, F7, F8, C3, C4, Cz, P3, P4, T3, T4, T5, T6, O1, and O2), left- and right electro-oculography (EOG), bipolar submental electromyography (EMG), electrocardiography (ECG), as well as abdominal and thoracic respiratory movements. EEG electrodes were referred to the contra lateral mastoid. We used the right mastoid as a reference for the midline EEG electrodes. Impedances for the EEG electrodes were kept below 5 kΩ. Signals were collected, pre-filtered, amplified and digitized at a sampling rate of 249 Hz/channel by using the 30 channel Flat Style SLEEP La Mont Headbox with implemented second order filters at 0.5 Hz (high pass) and 70 Hz (low pass) as well as the HBX32-SLP 32 channel preamplifier (La Mont Medical Inc. USA). An additional 50 Hz digital notch filtering performed by the DataLab acquisition software (Medcare, Iceland) was carried out before data analysis. Wakefulness and sleep stages of the second night recordings were identified manually by experienced scorers according to the standardized criteria (Rechtschaffen and Kales, 1968). Epochs containing artifacts detected by visual inspection of the EEG, EMG, EOG and ECG signals were excluded from further analyses. 2.2. Spindle analysis
The steps of sleep spindle analysis were the following:
We performed the above calculations for the first four periods of NREM sleep, including stages 2, 3 and 4 hence we obtained cycleby-cycle spindle-data for all subjects. 2.3. Validation by topography, sleep cycle- and age effectsSlow spindles are known to be relatively enhanced in anterior (frontal) as compared to posterior (parietal) channels, while the opposite is true for fast sleep spindles (Zeitlhofer et al., 1997). In order to test the validity of our sleep spindle analysis method we compared the measured characteristics of sleep spindles between the anterior and posterior channels. Consecutive NREM sleep episodes are characterized by a declining trend in slow spindle frequency activity and an increasing trend in high spindle frequency activity (Werth et al., 1997). Based on this assumption we compared the spindle characteristics of the first four NREM sleep episodes. Ageing is characterized by a decrease in sleep spindling, which is particularly strong in the third and fourth sleep cycle (Landolt et al.1996). Therefore we also tested the effects of age on sleep spindles analyzed by our method. In this procedure we used the spindle data of four recording sites: F3, P3, F4 and P4. 2.4. Comparison with visual detectionIn order to compare the IAM with visual detection of sleep spindles, there was selected a 15–20 min long artifact-free EEG segment from the record following the first 10 min of NREM sleep of the third sleep cycle in a subsample of 12 subjects. One of the authors (RB) performed the visual detection of sleep spindles in channels F4-A1 and P4-A1 separately. The results of visual spindle scoring were compared with the results of the automatic one in terms of match-mismatch, overlap, correlation and spectral content. Criteria for the visual detection were the following: a group of 9-16 Hz waves lasting at least 0.5 s. During the visual procedure a mark was set at both the beginning and the end of the individual sleep spindles. A match with automatic detection supposed at least one common point in the results of the two methods (IAM and visual) of spindle detections. Overlap was measured with number of common points and expressed in percents. By correlation analysis we intended to compare visual scoring and IAM with respect to their outcome of measuring individual differences in sleep spindling. Spectral features of the whole EEG segment, as well as of the exclusively automatic detections (EADs), exclusively visual detections, matching automatic-and-visual detections, and segments with no spindle detections were determined by average amplitude spectra based on mixed-radix FFTs of the corresponding segments. As the spectra of segments with different length were of different resolution we maximized the length of the analyzed segments in 2048 points. Segments longer than 2048 points were raveled to 2048 points, while the amplitude spectra of the shorter ones were interpolated to 2048 points by using the zero-insertion FFT procedure. The parallelism of the spectra was tested by Pearson- product moment correlations, while spectral contents according to the individual-specific spindle ranges were compared by analysis of variance. Signal processing was performed with DADiSP2002 (DSP Development Corp. USA), while statistical analyses with STATISTICA 7.1 (Statsoft Inc. USA). |
