Neurobiology of Aging, Volume 78, June 2019, Pages 87-97. DOI: 10.1016/j.neurobiolaging.2019.02.007
Péter P. Ujma1,2, Boris N. Konrad3, Péter Simor 4,8, Ferenc Gombos5, János Körmendi6, Axel Steiger7, Martin Dresler3,7, Róbert Bódizs1,2
1 Institute of Behavioural Sciences, Semmelweis University, Budapest, Hungary
2 National Institute of Clinical Neuroscience, Budapest, Hungary
3 Donders Institute of Brain, Cognition and Behaviour, Radboud University Medical Centre, Nijmegen, The Netherlands
4 Institute of Psychology, ELTE, Eötvös Loránd University, Budapest, Hungary
5 Department of General Psychology, Pázmány Péter Catholic University, Budapest, Hungary
6 Department of Electrical Engineering and Information Systems, Pannon University, Veszprém, Hungary
7 Max Planck Institute of Psychiatry, Munich, Germany
8 Nyírő Gyula Hospital, National Institute of Psychiatry and Addictions, Budapest, Hungary
Abstract
Variations in the anatomical and functional connectivity between brain areas underlie both healthy and pathological variation in psychological measures. Largely independent from external stimuli, the sleep EEG is particularly well suited to measure individual variations in functional brain connectivity. In this study of 172 healthy individuals (17-69 years old), we show that functional connectivity between distant brain areas – reflected by the weighted phase lag index of the sleep EEG – is strongly affected by the age and sex of participants.Both NREM and REM connectivity in the theta and beta range increased with age, whereas a decrease was seen in the sigma range. In females, connectivity was substantially greater than in males in the high sigma frequency range, but an opposite pattern was seen in the alpha/low sigma and beta range. General intelligence was not significantly associated with connectivity in either sex. Our results confirm strong age effects on sleep spindle-frequency activity, which t loses synchrony as a function of ageing. Furthermore, we found support for a vigilance state-independent age-related increase in high beta power, previously demonstrated in waking EEG studies. The results highlight that future studies establishing sleep EEG connectivity measures as psychological or psychiatric biomarkers should take into account that sleep EEG synchronization is strongly affected by age and sex, and clinical thresholds must be adjusted accordingly.
Highlights
– Sleep EEG is affected by ageing, reflecting cerebral changes
– NREM sigma connectivity is reduced with ageing
– REM/NREM theta/beta connectivity is increased with ageing
– Higher sigma connectivity in females, higher alpha and beta connectivity in males
– EEG biomarker studies should consider strong age and sex effects on connectivity
Introduction
The concept of functional connectivity originally arose from functional multiunit recordings (Aertsen and Preissl 1991; Gerstein and Perkel 1969) and it was adapted to fMRI methodology (Biswal et al. 1995; Friston 2011), referring to clusters of brain regions whose activity is consistently correlated: brain regions generating similar biological signals over time are considered functionally connected, even without directly observing their anatomical connections. The functional connectivity approach has been extended to the electroencephalogram (Thatcher et al. 1987), using coherence or similar metrics (e.g. phase lag indexes, entropy, synchronization likelihood etc.) between pairs of scalp EEG derivations as a simple and cost-efficient way of estimating the functional connectivity between the activity of the underlying cerebral regions. EEG-based functional and diffusion tensor imaging DTI-based anatomical connectivity are substantially, but not perfectly correlated (Chu et al. 2015). DTI may fail to capture functionally relevant unmyelinated fibers or indirect connections between functionally related activity clusters, such as common innervation from brainstem areas, while EEG connectivity has substantially lower spatial resolution and it is subject to spatial filtering artifacts due to the distance of the EEG electrodes from signal sources (Chu et al. 2015). Thus, while EEG-based functional connectivity is not without its shortcomings, it may capture couplings between brain areas which are missed by structural imaging approaches, and may therefore be relevant as a supplementary diagnostic marker in the wide variety of neurological and psychiatric conditions where the disease of the white matter system is at least a partial cause (Fields 2008; Nunez et al. 2015). In line with this theory, alterations in EEG connectivity were found in many clinical conditions, including Alzheimer’s disease and dementia (Blinowska et al. 2017; de Haan et al. 2009), major depressive disorder (Olbrich et al. 2014; Tas et al. 2015), bipolar depression (Kam et al. 2013; Ozerdem et al. 2011; Tas et al. 2015), autism (Goldani et al. 2014; O’Reilly et al. 2017) and schizophrenia (Uhlhaas and Singer 2010). A subset of studies (Armitage et al. 2006; Augustinavicius et al. 2014; Morehouse et al. 2002; Yeragani et al. 2006) found alterations specifically in sleep EEG connectivity measures in psychiatric conditions, highlighting the utility of using EEG measures in various vigilance states.
In order to use EEG functional connectivity as a marker of disease (or any other condition of interest), physiological sources of its individual variability must be known. While wake EEG measurements – usually lasting only a few minutes – are more feasible for most purposes, especially in clinical settings, such recordings are subject to biases due to external stimuli, circadian effects, muscle artifacts, imperfect representativeness of the short recorded session or contamination due to ongoing mentation (Tarokh et al. 2010). Sleep EEG parameters, on the other hand, are free from most of such wakefulness-specific artifacts, while they show substantial intra-individual stability (De Gennaro et al. 2005; Finelli et al. 2001) strong genetic determination (Adamczyk et al. 2015; De Gennaro et al. 2008) and direct reliance on the underlying anatomical structure of the brain (Piantoni et al. 2013; Saletin et al. 2013; Smit et al. 2012), rendering them good putative markers of inter-individual differences with easily controllable sources of confounding variance. Relatively few studies are available about the sources of normal sleep EEG connectivity variability, despite ample literature about at least sex (Carrier et al. 2001; Colrain et al. 2011; Driver et al. 1996; Huupponen et al. 2002; Ujma et al. 2014) and age (Åström and Trojaborg 1992; Carrier et al. 2001; Carrier et al. 2011; Dijk et al. 1989; Fogel et al. 2012; Guazzelli et al. 1986; Landolt et al. 1996; Martin et al. 2013; Principe and Smith 1982) effects on many other sleep EEG parameters. In childhood (Kurth et al. 2013) and adolescence (Tarokh et al. 2014) a linear, age-dependent increase in sleep EEG coherence in both REM and NREM sleep has been reported. In addition, children and young adults with Williams syndrome and Asperger syndrome were shown to be characterized by atypical sleep EEG synchronization patterns (Gombos et al. 2017; Lázár et al. 2010). However, no such data is available about healthy, young and middle-aged adults. To our knowledge, sex differences in sleep EEG connectivity have never been investigated, except for an early negative report with a total of 12 participants (Nielsen et al. 1990).
Parameters of the sleep EEG were previously found to be associated with general cognitive ability (Geiger et al. 2011; Ujma 2018; Ujma et al. 2017). One study (Tarokh et al. 2014) found no correlation between EEG coherence and baseline performance on three neurocognitive tasks with reasonable g-loadings (the Stroop test, Trail Making and the FAS verbal fluency task) in adolescents, but no previous study investigated the relationship between intelligence and the functional connectivity of the sleep EEG of adults, although wake EEG coherence and complexity measures were much better predictors than spectral power (Thatcher et al. 2005; Thatcher et al. 2008).
Our study aimed to fill these gaps and investigated age and sex effects on sleep EEG functional connectivity in an adult dataset which was substantially larger than previous ones (N=172). Both age and sex effects on sleep EEG connectivity were substantial. Furthermore, our study is the first to extend a previous wake EEG study design of coherence analysis (Thatcher et al. 2005) to sleep EEG and investigate the relationship between sleep EEG connectivity and general intelligence. This relationship, however, was not found to be statistically significant.
Methods
Participants and psychometric data
Our analyses were performed in an existing multi-center database of full night polysomnography recordings of adult (Pótári et al. 2017; Ujma et al. 2015; Ujma et al. 2014) participants. The absence of a diagnosis of any neurological or psychiatric disease was a requirement for inclusion and participants were free of any current drug effects, excluding contraceptives. 8 participants were light to moderate smokers, while the rest of the participants were non-smokers. For the participants, small, habitual doses of caffeine (max. 2 cups of coffee before noon) were allowed. Procedures were approved by the ethical boards of the involved institutions (Semmelweis University, Budapest; and the Ludwig Maximilian University, Munich). All procedures performed in studies involving human participants were in accordance with the ethical standards of the institutional and/or national research committee and with the 1964 Helsinki declaration and its later amendments or comparable ethical standards. Informed consent was obtained from all individual participants included in the study. All participants spent two nights in a sleep laboratory, of which the first night served as an adaptation night and data from the second night was used in subsequent analyses.
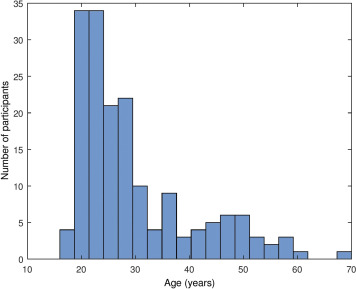
Participants with poor quality EEG data (characterized by the presence of wide frequency band artifacts and/or multiple electrode failures within the same electrode cluster, see under Data processing) were excluded and 15 novel recordings with available sex and age data, but without cognitive ability test scores were added, yielding a total sample size of N=172 (94 males, 78 females, mean age: 29.74 years, SD= 10.71 years, range 17-69 years). A histogram of the distribution of participant ages is given on Supplementary figure 1 . For analyses involving cognitive ability scores, only participants with such scores (N=157) were used.
The sex, age in years and general cognitive ability of each participant was recorded. General cognitive ability was assessed using either Raven’s Advanced Progressive Matrices (N=86) (Raven et al. 2004), the Culture Fair Test (N=113) (Cattell 1973) and/or the Number Connection Test (Zahlenverbindungstest) (N=106) (Oswald and Roth 1987). For each subject with multiple general cognitive ability scores, we converted the scores from CFT and/or ZVT raw scores to Raven equivalents by looking up the Raven APM score corresponding to the same IQ as the participant obtained using the other test (CFT or ZVT), taking into account the participant’s age. We used the 1993 Des Moines (Iowa) standardization of the Raven APM (Raven et al. 2004) as a reference. IQ test raw score intercorrelations were the following: rRaven-CFT =0.69, rRaven-ZVT =-0.57, rCFT-ZVT =-0.66. If multiple test scores were available, their Raven equivalents were averaged(Pótári et al. 2017; Ujma et al. 2014).
Males and females did not significantly differ in their age and Raven’s APM equivalent scores (tRaven =0.84, pRaven =0.4; tage =0.68, page =0.49).
Polysomnography
Polysomnography data was obtained at multiple recording centers (Pótári et al. 2017; Ujma et al. 2015; Ujma et al. 2014) with the common recording sites across studies and laboratories being: Fp1, Fp2, F3, F4, Fz, F7, F8, C3, C4, Cz, P3, P4, T3, T4, T5, T6, O1, and O2, electro-oculography (EOG), bipolar submental electromyography (EMG), as well as electrocardiography (ECG). Impedances for the EEG electrodes were kept below 8 kΩ. The sampling frequency was either 249 Hz, 250 Hz or 1024 Hz, depending on recording site.
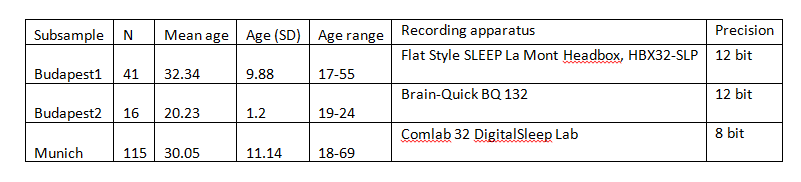
All recordings were referenced to the mathematically linked mastoids. Sample sizes, age distributions and further recording apparatus details are provided in Supplementary table 1 .
Data processing
All polysomnography recordings were visually scored by expert rates using standard criteria (Iber et al. 2007). Artifacts were rejected by visual inspection on a 4 second basis. In case of electrode failure, data from the affected electrodes was treated as missing data. However, if multiple electrodes from the same cluster failed (see later for the definition of electrode clusters), the subject was dropped from further analysis.
To calculate functional connectivity for each subject, EEG data was first separated into NREM (excluding N1) and REM data. The weighted phase-lag index (WPLI (Vinck et al. 2011)), defined as the phase leads or lags weighted by the magnitude of the imaginary part of the complex cross spectrum of the series (based on the Fast Fourier Transform), was calculated between all possible electrode pairs from the resulting time-frequency data, and finally averaged across all data segments and electrode pairs belonging to the same cluster, respectively. WPLI was chosen as a measure of functional connectivity because it penalizes exact in-phase and antiphase patterns between signals, which are likely the result of mass conductance rather than actual functional coupling.
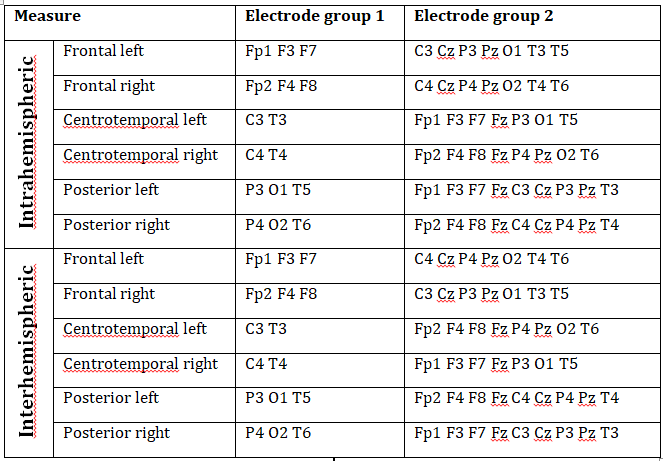
WPLI was averaged within electrode clusters in order to reduce the complexity of calculations and to smoothen out potentially spurious effects resulting from a single signal pair. Electrode clusters were the following: frontal (Fp1/2, F3/4, F7/8), centrotemporal (C3/4, T3/4) and posterior (P3/4, O1/2, T5/6) (Lázár et al. 2010). Analogous regions were defined over both the left and the right hemisphere, except for the central region, yielding a total of 6 electrode clusters. Central electrodes (Cz, Fz and Pz) were not included in any of the electrode clusters due to their lack of assignment to either hemisphere. WPLI was averaged for all possible signal pairs between electrodes in a certain electrode cluster and all other electrodes in the ipsilateral (intrahemispheric WPLI) or contralateral (interhemispheric WPLI) hemisphere for both REM and NREM sleep, yielding a total of 24 connectivity measures for each subject. Central electrodes (Fz, Cz and Pz) were not included in any electrode cluster, but they were included in both intrahemispheric and interhemispheric analyses as ipsilateral and contralateral electrodes, respectively, unless they were topographically included in the electrode cluster for which connectivity was calculated: that is, Fz was excluded from frontal, Cz from central and Pz from posterior measures. For example, NREM Posterior left intrahemispheric WPLI was defined as the grand average of the mean WPLI values (averaged across all 4-second segments in NREM sleep) between P3 and all non-posterior ipsilateral electrodes, O1 and all non-posterior ipsilateral electrodes and T5 and all non-posterior ipsilateral electrodes. Non-posterior ipsilateral electrodes in this case did not include Pz because of its posterior position, but did include Fz and Cz. A precise description of our connectivity measures is provided in Supplementary table 2 .
Statistics
WPLI values are, by definition, bounded between 0 and 1. In order to normalize variances across this range and permit scale-level statistics, all connectivity measures were transformed using the Fisher Z-transform before statistical analysis (Fisher 1915). We computed independent-sample t-tests (or the equivalent Welch t-test in case of unequal variances) to assess sex differences in connectivity, Pearson’s point-moment correlations in order to assess the correlation between connectivity and age, and Pearson’s partial correlations (corrected for Age) to assess the correlation between connectivity and general cognitive ability. We applied the Benjamini-Hochberg method (Benjamini and Hochberg 1995) across all frequencies for each connectivity measure in order to control for multiple comparisons. Statistical analyses were performed in Statistica (StatSoft Inc, Tulsa, OK), IBM SPSS Statistics (IBM Corporation, Armonk, NY) and MATLAB (The MathWorks, Natick, MA).
Results
Age effects on connectivity
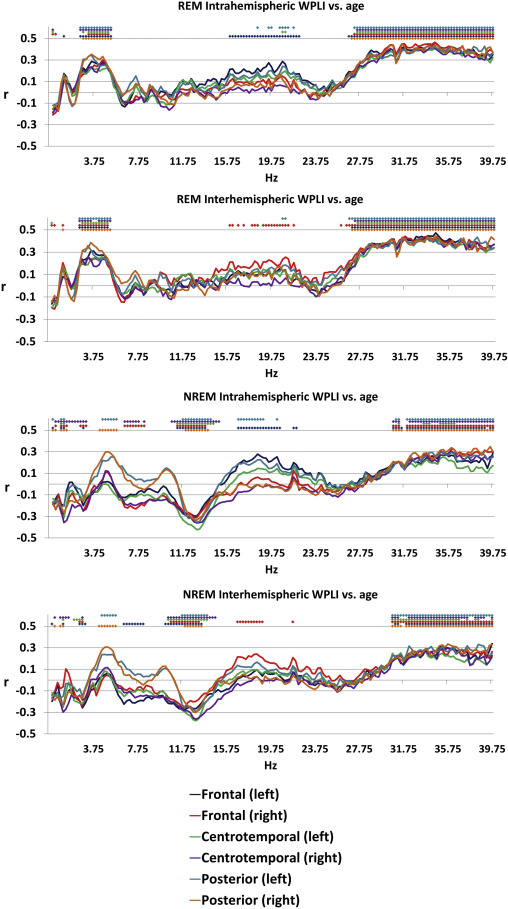
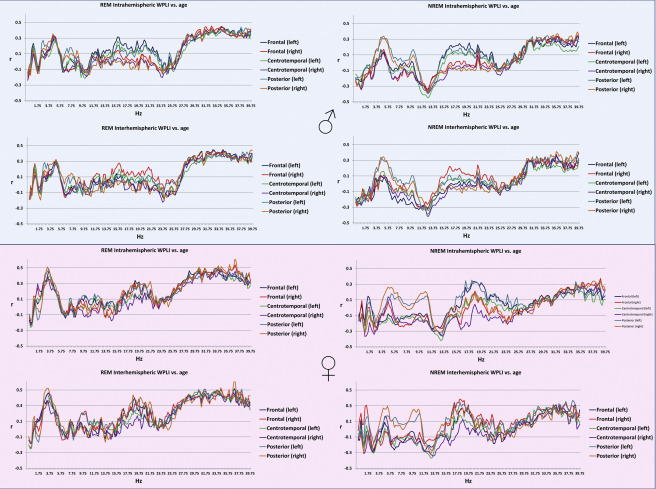
Age was associated with decreased connectivity in the NREM sigma range (10.25-14.75 Hz) and increased connectivity in both NREM theta (4.25-5.5 Hz) and beta (30.75-40 Hz) and REM theta (2.5-5.25 Hz) and beta (26.75-40 Hz) ranges. The topography of these effects (age-related increases in NREM and REM beta, as well as of REM theta WPLI) extended to most (at many frequencies, all) connectivity measures, with the exception of age-related increase in NREM theta synchronization. The latter was restricted to the age-related increases in the connectivity of the posterior regions with the other areas of the brain (Figure 1). These effects were similar in males and females (Supplementary figure 2).
Figure 1
Pearson’s correlation coefficients between age and connectivity . Colored dots indicate that the correlation coefficient for the given frequency was significant after Benjamini-Hochberg correction for multiple comparisons.
Sex differences in connectivity
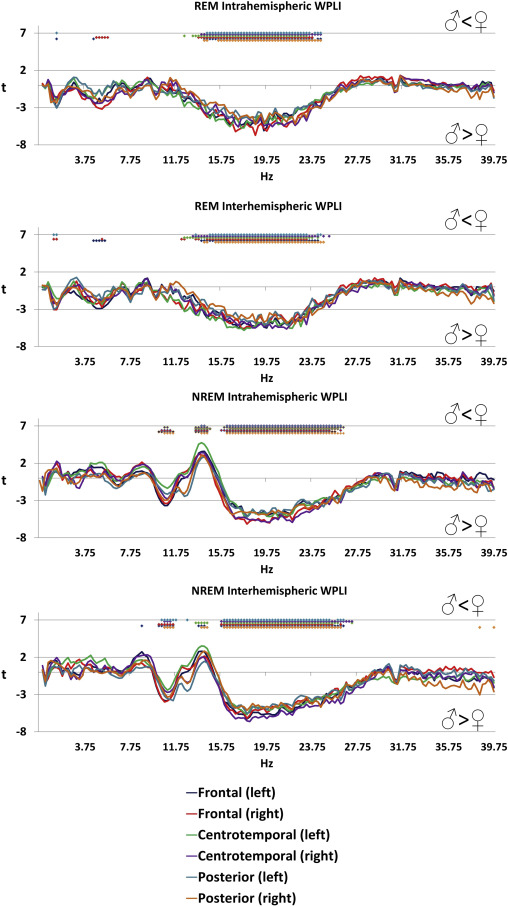
Several significant sex differences of functional connectivity were found, many of which were independent of scalp topography and sleep state (Figure 2 ). The most prominent differences were found in the NREM sigma range (13.5-14.5 Hz) with higher values in females, and in the beta range of both NREM (15.75-27.25 Hz) and REM (12.25-24.75 Hz) sleep, where higher values were seen in males. Higher connectivity in the NREM high alpha/low sigma range (10.25-11.75 Hz) was also found in males. The effect size of these differences was relatively large: the maximal magnitude of the higher female connectivity (at 14 Hz in the NREM intrahemispheric left centrotemporal connectivity measure) corresponded to a Cohen’s d of 0.73, while the maximal magnitude of the higher male connectivity (at 18.75 Hz in the REM intrahemispheric right frontal connectivity measure) corresponded to a Cohen’s d of 1.03, slightly lower than typical sex differences in body mass and body height, respectively (Conroy-Beam et al. 2015).
Figure 2
Sex differences in connectivity . Positive t-values indicate higher values in females while lower t-values indicate higher values in males. Colored dots indicate that the independent-samples t-test for the given frequency was significant after Benjamini-Hochberg correction for multiple comparisons.
Connectivity and general cognitive ability
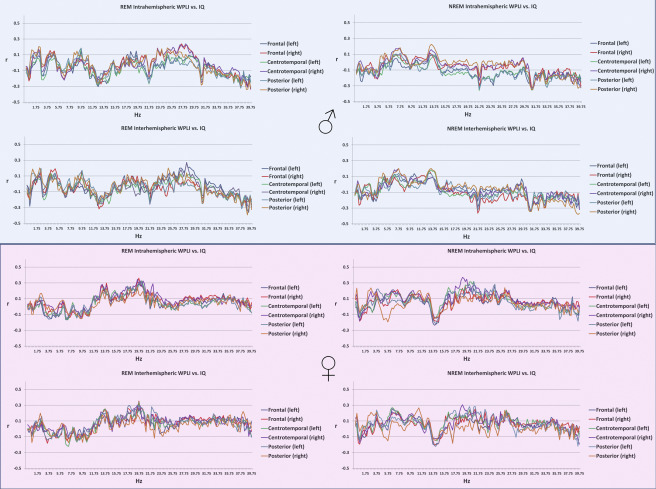
General cognitive ability, assessed through a composite score of three nonverbal tests, was not significantly associated with connectivity patterns of the sleep EEG after correcting for multiple comparisons (Figure 3), either in the whole sample or within sexes (except for a total of 7 discontinous frequency bins reaching significance in males, all in the NREM posterior interhemispheric measure at 31.25, 31.5, 32.75, 39.25, 39.5, 39.75 and 40 Hz, data not shown). Supplementary figure 3 shows the association between connectivity and general cognitive ability by sex.
Figure 3
Age-corrected Pearson’s correlation coefficients between general cognitive ability and connectivity . Correlation coefficients were not significant after Benjamini-Hochberg correction for multiple comparisons.
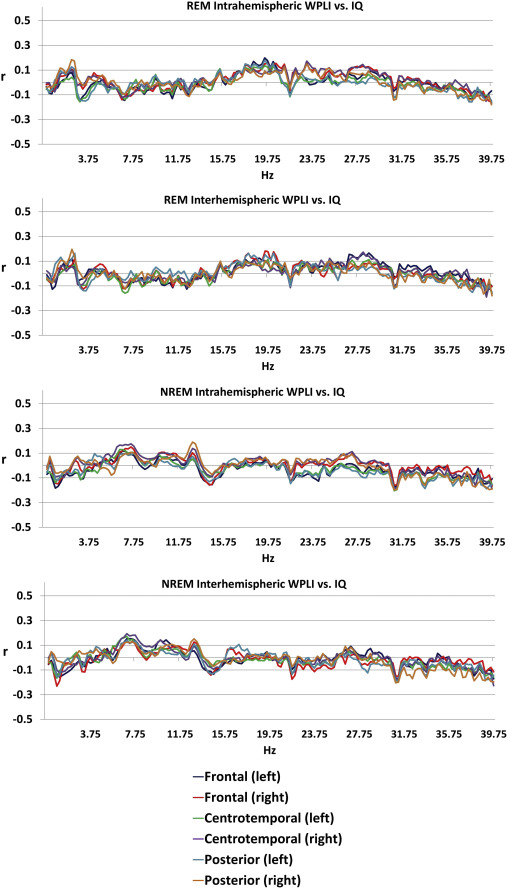
Figure 4 .
Sex differences and age-dependence of sleep EEG connectivity . Panel A and B depict male and female mean wPLI values in NREM and REM sleep, respectively, with 95% confidence intervals in each 0.25 Hz bin. Values are shown for the connectivity measures where sex differences were maximal. Panels C-E depict the correlation between age and wPLI values, with separate regression lines by sex. 13 Hz and 37 Hz effects were not significantly different between males and females (p=0.07 and p=0.52), but 3.5 Hz effects were significantly larger in males (p=0.004, all analyses based on the comparison of correlation coefficients using Fisher’s r-to-z method). All data is shown for the connectivity measure and frequency where the correlation was maximal.
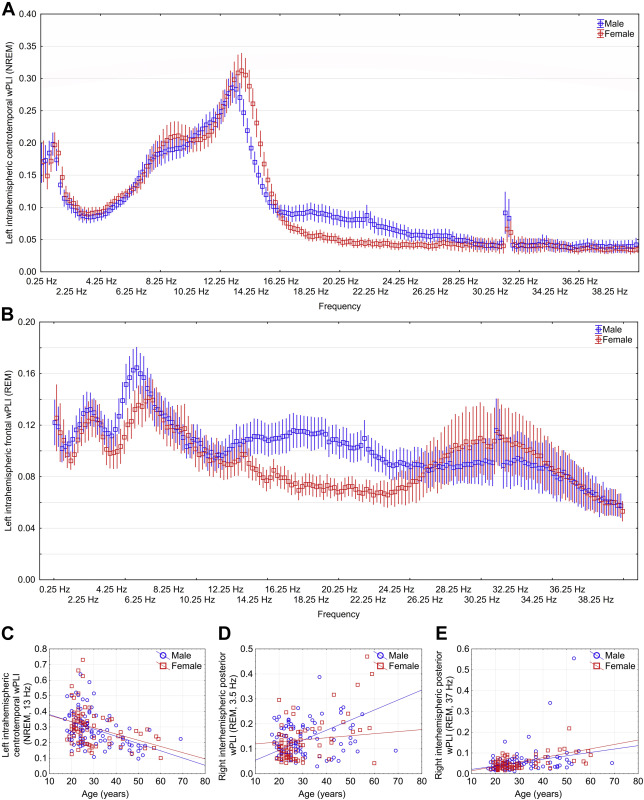
Figure 4. illustrates significant age and sex effects on EEG connectivity
With additional analyses (Supplementary text), we found that natural logarithmic and quadratic models yielded a worse fit than a linear model, and a cubic model was only minimally superior, confirming the linear nature of the age-connectivity relationship. We also assigned statistical weights to our participants to enforce to simulate a true population distribution of age, and found that our results are robust to the restriction of the age range of participants, with the possible exception of the 3.5 Hz REM oscillation.
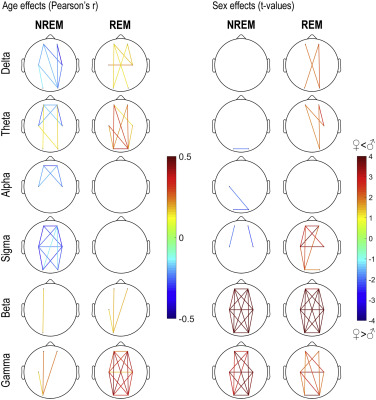
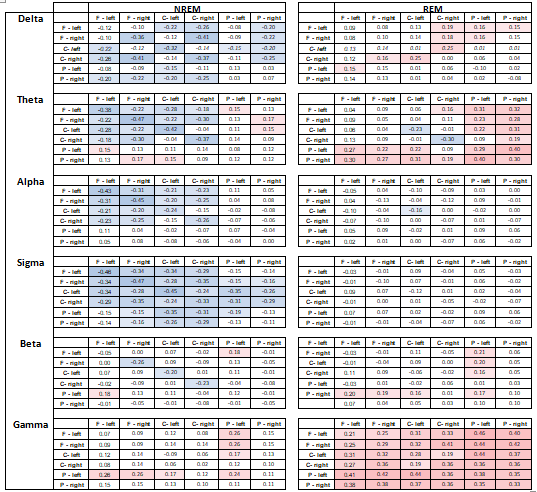
Finally, in order to test the hypothesis whether general effects are caused by small clusters of actual connectivity, we increased the resolution of our analysis by averaging wPLI between all possible pairs of clusters, yielding 6*6=36 connectivity measures, including connectivity within different electrodes in the same cluster. We averaged wPLI values within traditional EEG bands: 1-3 Hz (delta), 3.25-7.75 Hz (theta), 8-10.75 Hz (alpha), 11-15.75 Hz (sigma), 16-25 Hz (beta) and 25.25-48 Hz (gamma) separately in REM and NREM sleep. We calculated the correlation of these measures with age and their differences between the sexes. These results are shown on Figure 5, and reported in detail in Supplementary tables 3 and 4 , which also contain same-cluster connectivity effects. Our results indicate that age-related decreases in low-frequency activity is concentrated in frontal and central areas, and age-related increases in theta activity is concentrated in posterior areas. However, our main age-related findings – a reduction in sigma connectivity and an increase in gamma connectivity – were present with a widespread and general topography. Higher female connectivity was most prominent in frontal and central intrahemispheric comparisons, but higher male beta and gamma connectivity were topographically widespread. Note that sex effects were heterogeneous within the broad sigma range (Figure 2), limiting the power of bandwise comparisons.
Figure 5
Pearson correlation coefficients between age and wPLI values (left) and t-values of male-female differences in wPLI (right). wPLI values averaged between all frequency bins in a frequency band and between all possible electrode pairs in the two electrode clusters. Positive t-values indicate higher values in males. Only connectivity measures with at least nominally significant age or sex effects are shown.
Discussion
Our main results can be summarized as follows: 1) NREM sleep EEG connectivity in the sigma frequency range increases with maturation but decreases with ageing, while aging is also associated with a sleep state-independent increase in sleep EEG beta and theta-range connectivity; 2) NREM sleep EEG connectivity in the high sigma frequency range is higher in females but in the alpha/low sigma and beta frequency range (in the latter partially also in REM sleep) it is larger in males. We did not find a significant association between connectivity and general intelligence in either sex.
The association between sleep EEG connectivity and age is well in line with the previously reported gross reduction in sleep spindle activity (Carrer et al. 2001; Carrier et al. 2011; Martin et al. 2013; Pincipe and Smith 1982) and an increase in beta activity (Carrier et al. 2001). As expected, reductions in the sigma range are confined to NREM sleep where sleep spindles are present and where characteristic peaks were reported not only for the power spectrum, but also for coherence (Achermann and Borbely 1998a; Achermann and Borbely 1998b). Beta increases were, however, observed in both NREM and REM sleep, indicating a state-independent effect. Importantly, a very similar effect – including the loss of coherence at lower frequencies – has been reported in a very large sample of wake EEGs (Vysata et al. 2014), indicating that higher beta-range connectivity is a vigilance state-independent correlate of ageing. Since the spatial extent of neural activity synchronization decreases as a function of frequency (Baria et al. 2011; Chu et al. 2015; Tallon-Baudry 2009), and high-frequency oscillations remain especially local without the support of prominent white matter connections (Chu et al. 2015), it is likely that the age-related loss of white matter (Yap et al. 2013) causes a breakdown of low-frequency connectivity over distant areas and an increase of synchronization in local networks. Notably, most age effect on connectivity had a very general topography, indicating that age-related changes in functional connectivity are widespread. However, age-dependent increases with relatively restricted topography were found for NREM sleep EEG theta connectivity. The latter was confined to neural paths binding posterior sites with more rostral ones.
Our findings regarding the age-associated increase in REM and NREM sleep EEG theta connectivity are without antecedents in the literature. All available reports on age-relatedness of EEG connectivity focus on wakefulness (Duffy et al. 1995; Vysata et al. 2014), and all report an age-related decrease in low frequency wake EEG coherence. Our current findings suggest the state-specificity of these correlations as well as the importance of distinguishing (REM) sleep EEG theta synchronization from that of theta connectivity in the state of wakeful rest, particularly as low-frequency waves in REM sleep, NREM sleep and wakefulness have different neural generators (Bodizs et al. 2001; Montplaisir et al. 1998). Another possible reason for the diverging results may be methodological one: while coherence (used in older studies) is sensitive to amplitude covariation and volume conduction, WPLI (used by our study) is completely free of these shortcomings. In short, a high zero-phase synchrony in the theta frequency rage could result in high coherence but low WPLI.
Regarding sex differences, higher female sigma connectivity and higher male alpha/low sigma and beta connectivity were found. Sleep spindling is arguably more prominent in females in general, as higher sleep spindle amplitude and sigma EEG power has been previously reported in females (Ujma et al. 2014). Functional connectivity is generally higher in females (Duffy et al. 1995; Gong et al. 2009; Tomasi and Volkow 2012). A large study (Ingalhalikar et al. 2014) also found substantial sex differences in DTI-derived structural connectivity, with higher long-distance interhemispheric connectivity in females. In light of these reports, greater female connectivity is unsurprising and it may reflect both higher sleep spindle generation and long-distance connectivity in females. It must be noted, however, that an even larger study of an older (>45 years old) sample under publication (Ritchie et al. 2017) found higher fractional anisotropy values in males instead of females, although higher white mater complexity was still found in females.
Higher male NREM and REM low beta connectivity in males is a novel finding. Notably, it is in a different frequency range than the one affected by age (≤25 Hz, while age-related effects are usually at ≥25 Hz, see Figures 1 and 2). It is unlikely to be caused by a reduction in sleep quality, because no sex differences are seen in the current dataset when sleep macrostructure is compared (Ujma et al. 2017). In the absence of relevant previous literature it is not possible to interpret the functional significance of this oscillation, although its frequency is the same as that of REM beta oscillations recently described in the frontal cortex (Vijayan et al. 2017) the characteristic power of which we found to positively correlate with intelligence (Ujma et al. 2017).
A further finding withoutantecedents in the literature is the increased NREM sleep EEG alpha/low sigma connectivity in males as compared to females. This finding might be interpreted as another case of state-specific oscillatory phenomena, perhaps involving the physiological mechanisms of slow sleep spindles during NREM sleep as well. In order to discern the potential routes of this higher male NREM sleep EEG alpha/low sigma connectivity, further studies focusing on sleep stage and cycle effects, as well as an individualization of sleep spindle frequencies are needed.
Our study failed to find an association between sleep EEG connectivity patterns and general cognitive ability, at odds with waking EEG results (Thatcher et al. 2005; Thatcher et al. 2008). The most likely reason for this is that reasoning in wakefulness may be supported by synchronization patterns which are disengaged during sleep and therefore not detectable using the sleep EEG.
Overall, our findings therefore confirm previous studies about the dependence of sleep EEG features on sex (Carrier et al. 2001; Colrain et al. 2011; Driver et al. 1996; Huupponen et al. 2002; Ujma et al. 2014) and age (Åström and Trojaborg 1992; Carrier et al. 2001; Carrier et al. 2011; Dijk et al. 1989; Fogel et al. 2012; Guazzelli et al. 1986; Landolt et al. 1996; Martin et al. 2013; Pincipe and Smith 1982), extending results about spectral power and microstructural features into connectivity. Our results are of particular importance for future clinical applications.
In 2010, the National Institute of Mental Health (NIMH) called for an evidence-based classification of psychological phenomena and mental disorders, labeled Research Domain Criteria (RDoC) (Insel et al. 2010). RDoC aims to classify psychological constructs and their relationship to mental disorders based on objective measurement instead of the traditional nomenclature of the DSM-V. Electrophysiological measures are listed as possible biomarkers, foreshadowing their importance in future psychological and psychiatric classification systems. However, the search for actual biomarkers in several neurological and especially psychiatric disorders is still ongoing (Boksa 2013; Venkatasubramanian and Keshavan 2016), and the currently available biomarkers for – among others – psychosis (Prata et al. 2014), autism (Goldani et al. 2014) and even Alzheimer’s disease (Wurtman 2015) are not satisfactory. Functional connectivity, estimated by scalp EEG measures, is an indirect and imperfect approximation of the actual connectivity patterns of the brain: however, its agreement with anatomically derived connectivity measures is not trivial (Chu et al. 2015), it likely captures meaningful functional coupling between brain regions even if DTI fails to discover a supporting anatomical pathway (Chu et al. 2015; Nunez et al. 2015) and the simple and cost-efficient way in which it can be measured renders it a particularly attractive clinical marker even if the physiological details of its generation are poorly understood. Alterations in EEG connectivity were found in various psychiatric and neurological conditions (Babiloni et al. 2016; Blinowska et al. 2017; de Haan et al. 2009; Fields 2008; Kam et al. 2013; Li et al. 2016; O’Reilly et al. 2017; Olbrich et al. 2014; Ozerdem et al. 2011; Tas et al. 2015; Uhlhaas and Singer 2010), supporting its potential role as a clinical biomarker which can be used to indicate the risk, severity or treatment response of various conditions. Most previous clinical EEG connectivity studies investigated EEG recorded for short wakeful resting periods. Due to its high individual stability and strong reliance on an anatomical and genetic scaffold (De Gennaro et al. 2008; Landolt 2011; Piantoni et al. 2013; Saletin et al. 2013; Smit et al. 2012), the sleep EEG is an even more interesting potential clinical biomarker, which is harder to obtain from patients but shows even more promise (Al-Qazzaz et al. 2014; Olbrich and Arns 2013; Steiger and Kimura 2010; Steiger et al. 2015; Tsolaki et al. 2014). However, our results indicate that connectivity measures in the sleep EEG are subject to robust physiological variation as a function of both age and sex: therefore, connectivity-based biomarkers must be carefully tailored based on age and sex.
Our study suffers from a number of shortcomings. We calculated connectivity between electrode clusters defined by a previous study (Lázár et al. 2010), reducing the spatial resolution of our estimations of functional connectivity. However,we found age and sex effects on connectivity to be quite general instead of limited to certain specific connectivity measures, indicating that low spatial resolution was likely not an issue for the detection of these effects. We further investigated this by using band-wise comparisons between specific electrode clusters, which mostly confirmed the hypothesis of topographically widespread effects. Our sample did not involve a healthy older adult population, the oldest participants being 69 years old and most of the older half of the sample being only in their forties, therefore our findings about sleep EEG connectivity alterations as a function of age are only representative of a limited section of the human lifespan. We attempted to partially correct for this by weighting subjects to enforce a representative age distribution, which resulted in the replication of most key findings. Furthermore, it must be also noted that sex and age effects may not be direct, but instead mediated by environmental exposures correlated to these variables. Therefore, it is possible that these correlates of age and sex are not uniform across all environments.
Funding
This study was supported by the Hungarian Medical Research Council (ETT-162/2003) and the Hungarian National Research Fund (OTKATS-049785), the Hungarian Brain Research Program (KTIA_NAP_13-1-2013-0001), the Higher Education Institutional Excellence Programme of the Ministry of Human Capacities in Hungary (within the framework of the Neurology thematic programme of the Semmelweis University), as well as the general budgets of the Max Planck Institute of Psychiatry and the Institute of Behavioural Sciences, Semmelweis University. Péter P. Ujma was supported by the ÚNKP-16-4 New National Excellence Program of the Ministry of Human Capacities. Péter Simor was supported by the Bolyai János Scholarship of the Hungarian Academy of Sciences, the ÚNKP-18-4 New National Excellence Program of the Ministry of Human Capacities in Hungary, and by the Hungarian Scientific Research Fund (NKFI FK 128100) of the National Research, Development and Innovation Office.
Conflict of Interest
The authors declare that they have no conflict of interest.
Ethical approval
All procedures performed in studies involving human participants were in accordance with the ethical standards of the institutional and/or national research committee and with the 1964 Helsinki declaration and its later amendments or comparable ethical standards.
Informed consent
Informed consent was obtained from all individual participants included in the study.
Appendix A
Supplementary data
Supplementary figure 1.
Histogram of participant ages.
Supplementary figure 2.
Pearson’s correlation coefficients between age and intrahemispheric (upper panels within plot half) and interhemispheric (lower panels within plot half) connectivity in REM (left panels) and NREM (right panels) sleep in males (upper half) and females (lower half).
Supplementary figure 3.
Age-corrected Pearson’s correlation coefficients between general cognitive ability and intrahemispheric (upper panels within plot half) and interhemispheric (lower panels within plot half) connectivity in REM (left panels) and NREM (right panels) sleep in males (upper half) and females (lower half).
Supplementary table 1.
Subsample-wise sample sizes, age distributions and recording apparatus characteristics
Supplementary table 2.
A summary of all connectivity measures used in this article. A measure is calculated as the average wPLI value of all possible pairs of wPLI values between the electrodes in Electrode region 1 and Electrode region 2.
Supplementary table 3.
Pearson correlation coefficients between age and wPLI values averaged between all frequency bins in a frequency band and between all possible electrode pairs in the two electrode clusters indicated at the margins. Same-cluster wPLI values are calculated between all electrode pairs within the same cluster, not including autocoherences. Positive values indicate higher values in males. Only cells with nominally significant results (modulus(r)>0.15) are highlighted. Cluster codes: F=frontal, C=central, P=posterior.
Supplementary table 4.
T-values of male-female differences in wPLI values averaged between all frequency bins in a frequency band and between all possible electrode pairs in the two electrode clusters indicated at the margins. Same-cluster wPLI values are calculated between all electrode pairs within the same cluster, not including autocoherences. Positive values indicate higher values in males. Only cells with nominally significant results (modulus(t)>1.96) are highlighted. Cluster codes: F=frontal, C=central, P=posterior

Supplementary text
Our analyses highlighted several significant associations between sleep EEG connectivity values and sex and age. With the subsequent analyses we aimed to discover whether our findings are 1) better accounted for by nonlinear models 2) robust to restrictions of the age range of participants and 3) driven by associations by specific patterns of electrode clusters instead of the topographically widespread effects our original methods were designed to detect.
In order to investigate the presence of nonlinear effects between age and connectivity, we fitted nonlinear regression models to the strongest age-wPLI associations depicted on Figure 7. We regressed age on connectivity using natural logarithmic, quadratic and cubic models. For all 3 connectivity measures, logarithmic and quadratic models using connectivity as the dependent and age as the independent variable provided a slightly worse fit than simple linear models. Cubic models achieved better fit, but the increase in R2 was negligible (ΔR2REM_theta=0.009 ;ΔR2REM_beta=0.017 ; ΔR2NREM_sigma=0.003). Overall, these results suggest that the assumption of linear change is a decent model of age-related connectivity changes.
While our sample had participants between 17-69 years of age, two thirds of all participants were under 30 years old. In order to test whether our effects were driven by this restriction of age range, we used Deming and Stefan’s raking ratio method (Deming and Stephan 1940) implemented in XLStat to assign statistical weights to our participants to emulate the true population distribution of Germany, the country where most participants originated from (based on Eurostat 2013 data with 5 year age bins). Using weighted data, we obtained the following correlations: rREM_37Hz=0.232, p=0.001 (unweighted: r=0.381, p<0.001); rREM_3.5Hz=0.082, p=0.287 (unweighted: r=0.334, p<0.001); rNREM_13Hz=-0.517, p<0.001 (unweighted: r=-0.4, p<0.001). Thus, our results were replicated for 37 Hz REM connectivity, an even stronger correlation was obtained for 13 Hz NREM connectivity, but the correlation 3.5 Hz REM connectivity was not replicated, possibly because the oldest subjects with very high assigned weights were relative outliers from the positive trend. Peak sex differences were also replicated using weighted data: tNREM_14Hz=2.1, p=0.038 (unweighted: t=4.55, p<0.001), tREM_18.75Hz=5.405, p<0.001 (unweighted: t=5.33, p<0.001).
References
Deming WE, Stephan FF (1940) On a Least Squares Adjustment of a Sampled Frequency Table When the Expected Marginal Totals are Known Ann Math Statist 11:427-444 doi:10.1214/aoms/1177731829
Uncorrected IQ vs wPLI Coherence reanalysis
References
- Achermann P., and Borbely A.A.: Coherence analysis of the human sleep. electroencephalogram Neuroscience 1998; 85: pp. 1195-1208
- Achermann P., and Borbely A.A.: Temporal evolution of coherence and power in the human sleep. electroencephalogram Journal of sleep research 1998; 1: pp. 36-41
- Adamczyk M., Ambrosius U., Lietzenmaier S., Wichniak A., Holsboer F., and Friess E.: Genetics of rapid eye movement sleep in humans Transl Psychiatry 2015; 7: pp. 85
- Aertsen A, Preissl H Dynamics of activity and connectivity in physiological neuronal networks. In: Schuster HG (ed) Non Linear Dynamics and Neuronal Networks, 1991. pp 281-302. doi:citeulike-article-id:2827039
- Al-Qazzaz N.K., Ali S.H.B.M.D., Ahmad S.A., Chellappan K., Islam M.S., and Escudero J.: Role of EEG as Biomarker in the Early Detection and Classification of Dementia. The Scientific World Journal 2014; 2014: pp. 906038
- Armitage R, Hoffmann R, Emslie G, Rintelmann J, Robert J (2006) Sleep microarchitecture in childhood and adolescent depression: temporal coherence Clinical EEG and neuroscience 37:1-9 doi:10.1177/155005940603700103
- Åström C., and Trojaborg W.: Relationship of Age to Power Spectrum Analysis of EEG During Sleep. Journal of Clinical Neurophysiology 1992; 9: pp. 424-430
- Augustinavicius J.L., Zanjani A., Zakzanis K.K., and Shapiro C.M.: Polysomnographic features of early-onset depression: a meta-analysis. Journal of affective disorders 2014; 158: pp. 11-18
- Babiloni et al., 2016. lzheimer’s Disease Individuals from Cortical Sources of Resting State EEG Rhythms. Front Neurosci 2016; 10:
- Baria A.T., Baliki M.N., Parrish T., and Apkarian A.V.: Anatomical and functional assemblies of brain BOLD oscillations. The Journal of neuroscience : the official journal of the Society for Neuroscience 2011; 31: pp. 7910-7919
- Benjamini Y, Hochberg Y (1995) Controlling the false discovery rate: a practical and powerful approach to multiple testing Journal of the Royal Statistical Society Series B (Methodological):289-300
- Biswal B., Zerrin Yetkin F., Haughton V.M., and Hyde J.S.: Functional connectivity in the motor cortex of resting human brain using echo-planar mri. Magnetic Resonance in Medicine 1995; 34: pp. 537-541
- Blinowska K.J., Rakowski F., Kaminski M., De Vico Fallani F., Del Percio C., Lizio R., and Babiloni C.: Functional and effective brain connectivity for discrimination between Alzheimer’s patients and healthy individuals: A study on resting state EEG rhythms Clinical neurophysiology. official journal of the International Federation of Clinical Neurophysiology 2017; 128: pp. 667-680
- Bodizs R, Kantor S, Szabo G, Szucs A, Eross L, Halasz P (2001) Rhythmic hippocampal slow oscillation characterizes REM sleep in humans Hippocampus 11:747-753 doi:10.1002/hipo.1090
- Boksa P.: A way forward for research on biomarkers for psychiatric disorders. Journal of Psychiatry & Neuroscience : JPN 2013; 38: pp. 75-77
- Carrier J., Land S., Buysse D.J., Kupfer D.J., and Monk T.H.: The effects of age and gender on sleep EEG power spectral density in the middle years of life (ages 20–60 years old). Psychophysiology 2001; 38: pp. 232-242
- Carrier J., et al: Sleep slow wave changes during the middle years of life European. Journal of Neuroscience 2011; 33: pp. 758-766
- Cattell RB (1973) Culture fair intelligence test : (a measure of “g”). Institute for Personality and Ability Testing, Champaign, Ill.
- Chu C.J., et al: EEG functional connectivity is partially predicted by underlying white matter connectivity. NeuroImage 2015; 108: pp. 23-33
- Colrain I.M., et al: Independent contributions of cortical gray matter. aging, sex and alcoholism to K-complex amplitude evoked during sleep Sleep 2011; 34: pp. 787-795
- Conroy-Beam D., Buss D.M., Pham M.N., and Shackelford T.K.: How Sexually Dimorphic Are Human Mate Preferences? Personality and Social Psychology Bulletin 2015; 41: pp. 1082-1093
- De Gennaro L., Ferrara M., Vecchio F., Curcio G., and Bertini M.: An electroencephalographic fingerprint of human sleep. NeuroImage 2005; 26: pp. 114-122
- De Gennaro L., et al: The electroencephalographic fingerprint of sleep is genetically determined: a twin study. Annals of neurology 2008; 64: pp. 455-460
- de Haan W., Pijnenburg Y.A., Strijers R.L., van der Made Y., van der Flier W.M., Scheltens P., and Stam C.J.: Functional neural network analysis in frontotemporal dementia and Alzheimer’s disease using EEG and graph theory. BMC Neurosci 2009; 10: pp. 1471-2202
- Deming W.E., and Stephan F.F.: On a Least Squares Adjustment of a Sampled Frequency Table When the Expected Marginal Totals are Known. Ann Math Statist 1940; 11: pp. 427-444
- Dijk D.J., Beersma D.G.M., and van den Hoofdakker R.H.: All night spectral analysis of EEG sleep in young adult and middle-aged male subjects. Neurobiology of Aging 1989; 10: pp. 677-682
- Driver H.S., Dijk D.J., Werth E., Biedermann K., and Borbely A.A.: Sleep and the sleep electroencephalogram across the menstrual cycle in young healthy women. J Clin Endocrinol Metab 1996; 81: pp. 728-735
- Duffy F.H., McAnulty G.B., and Albert M.S.: Effects of age upon interhemispheric EEG coherence in normal adults. Neurobiology of Aging 1995; 17: pp. 587-599
- Fields R.D.: White matter in learning. cognition and psychiatric disorders Trends in Neurosciences 2008; 31: pp. 361-370
- Finelli LA, Achermann P, Borbely AA (2001) Individual ‘fingerprints’ in human sleep EEG topography Neuropsychopharmacology 25:S57-62
- Fisher R.A.: Frequency Distribution of the Values of the Correlation Coefficient in Samples from an Indefinitely Large Population. Biometrika 1915; 10: pp. 507-521
- Fogel S., et al: NREM sleep oscillations and brain plasticity in aging. Frontiers in neurology 2012; 3:
- Friston KJ (2011) Functional and effective connectivity: a review Brain Connect 1:13-36
- Geiger A., Huber R., Kurth S., Ringli M., Jenni O.G., and Achermann P.: The sleep EEG as a marker of intellectual ability in school age children. Sleep 2011; 34: pp. 181-189
- Gerstein G.L., and Perkel D.H.: Simultaneously recorded trains of action potentials: analysis and functional interpretation. Science 1969; 164: pp. 828-830
- Goldani AA, Downs SR, Widjaja F, Lawton B, Hendren RL (2014) Biomarkers in autism Front Psychiatry 5
- Gombos F., Bódizs R., and Kovács I.: Increased overall cortical connectivity with syndrome specific local decreases suggested by atypical sleep-EEG synchronization in Williams syndrome. Scientific reports 2017; 7: pp. 6157
- Gong G., He Y., Concha L., Lebel C., Gross D.W., Evans A.C., and Beaulieu C.: Mapping anatomical connectivity patterns of human cerebral cortex using in vivo diffusion tensor imaging tractography. Cerebral cortex 2009; 19: pp. 524-536
- Guazzelli M., Feinberg I., Aminoff M., Fein G., Floyd T.C., and Maggini C.: Sleep spindles in normal elderly: comparison with young adult patterns and relation to nocturnal awakening. cognitive function and brain atrophy Electroencephalography and Clinical Neurophysiology 1986; 63: pp. 526-539
- Huupponen E., Himanen S.L., Varri A., Hasan J., Lehtokangas M., and Saarinen J.: A study on gender and age differences in sleep spindles. Neuropsychobiology 2002; 45: pp. 99-105
- Iber C, Ancoli-Israel S, Chesson A, Quan S (2007) The AASM Manual for the Scoring of Sleep and Associated Events: Rules, Terminology and Technical Specification. 1st edn. American Academy of Sleep Medicine, Westchester, IL. doi:citeulike-article-id:6450986
- Ingalhalikar M., et al: Sex differences in the structural connectome of the human brain. Proceedings of the National Academy of Sciences 2014; 111: pp. 823-828
- Insel T., et al: Research domain criteria (RDoC): toward a new classification framework for research on mental disorders. Am Psychiatric Assoc, Kam JW, Bolbecker AR, O’Donnell BF, Hetrick WP, Brenner CA (2013) Resting state EEG power and coherence abnormalities in bipolar disorder and schizophrenia. J Psychiatr Res 2010; 47: pp. 1893-1901
- Kurth S., Achermann P., Rusterholz T., and LeBourgeois M.K.: Development of Brain EEG Connectivity across Early Childhood: Does Sleep Play a Role? Brain sciences 2013; 3: pp. 1445-1460
- Landolt H.-P., Dijk D.-J., Achermann P., and Borbély A.A.: Effect of age on the sleep EEG: slow-wave activity and spindle frequency activity in young and middle-aged men. Brain Research 1996; 738: pp. 205-212
- Landolt HP (2011) Genetic determination of sleep EEG profiles in healthy humans Progress in brain research 193:51-61
- Lázár A.S., et al: Reduced fronto-cortical brain connectivity during NREM sleep in Asperger syndrome: An EEG spectral and phase coherence study. Clinical Neurophysiology 2010; 121: pp. 1844-1854
- Li Y., Kang C., Qu X., Zhou Y., Wang W., and Hu Y.: Depression-Related Brain Connectivity Analyzed by EEG Event-Related Phase Synchrony Measure. Front Hum Neurosci 2016; 10:
- Martin N., et al: Topography of age-related changes in sleep spindles. Neurobiol Aging 2013; 34: pp. 468-476
- Montplaisir J., Petit D., Gauthier S., Gaudreau H., and Decary A.: Sleep disturbances and eeg slowing in alzheimer’s disease Sleep. Res Online 1998; 1: pp. 147-151
- Morehouse R.L., Kusumakar V., Kutcher S.P., LeBlanc J., and Armitage R.: Temporal coherence in ultradian sleep EEG rhythms in a never-depressed. high-risk cohort of female adolescents Biological psychiatry 2002; 51: pp. 446-456
- Nielsen T., Abel A., Lorrain D., and Montplaisir J.: Interhemispheric EEG coherence during sleep and wakefulness in left- and right-handed subjects. Brain Cogn 1990; 14: pp. 113-125
- Nunez P.L., Srinivasan R., and Fields R.D.: EEG functional connectivity, axon delays and white matter disease Clinical neurophysiology. official journal of the International Federation of Clinical Neurophysiology 2015; 126: pp. 110-120
- O’Reilly C., Lewis J.D., and Elsabbagh M.: Is functional brain connectivity atypical in autism? A systematic review of EEG and MEG studies. PloS one 2017; 12:
- Olbrich S., and Arns M.: EEG biomarkers in major depressive disorder: discriminative power and prediction of treatment response. Int Rev Psychiatry 2013; 25: pp. 604-618
- Olbrich S., Trankner A., Chittka T., Hegerl U., and Schonknecht P.: Functional connectivity in major depression: increased phase synchronization between frontal cortical EEG-source estimates. Psychiatry research 2014; 222: pp. 91-99
- Oswald WD, Roth E (1987) Der Zahlen-Verbindungs-Test (ZVT). Ein sprachfreier Intelligenz-Test zur Messung der „kognitiven Leistungsgeschwindigkeit“. Handanweisung (2., überarbeitete und erweiterte Auflage). Hogrefe, Göttingen
- Ozerdem A., Guntekin B., Atagun I., Turp B., and Basar E.: Reduced long distance gamma (28-48 Hz) coherence in euthymic patients with bipolar disorder. Journal of affective disorders 2011; 132: pp. 325-332
- Piantoni G., Poil S.S., Linkenkaer-Hansen K., Verweij I.M., Ramautar J.R., Van Someren E.J., and Van Der Werf Y.D.: Individual differences in white matter diffusion affect sleep oscillations. The Journal of neuroscience : the official journal of the Society for Neuroscience 2013; 33: pp. 227-233
- Pótári A et al. (2017) Age-related changes in sleep EEG are attenuated in highly intelligent individuals NeuroImage 146:554-560 doi: https://doi.org/10.1016/j.neuroimage.2016.09.039
- Prata D., Mechelli A., and Kapur S.: Clinically meaningful biomarkers for psychosis: a systematic and quantitative review. Neuroscience and biobehavioral reviews 2014; 45: pp. 134-141
- Principe JC, Smith JR (1982) Sleep spindle characteristics as a function of age Sleep 5:73-84
- Raven JC, Raven J, Court J (1962) Coloured progressive matrices. HK Lewis London, Raven JC, Raven J, Court JH (2004) Raven Haladó Progresszív Mátrixok Kézikönyv. Edge2000 Kft., Budapest
- Ritchie SJ et al. (2017) Sex Differences In The Adult Human Brain: Evidence From 5,216 UK Biobank Participants bioRxiv doi:10.1101/123729
- Saletin J.M., van der Helm E., and Walker M.P.: Structural brain correlates of human sleep oscillations. NeuroImage 2013; 83: pp. 658-668
- Smit D.J., Boomsma D.I., Schnack H.G., Hulshoff Pol H.E., and de Geus E.J.: Individual differences in EEG spectral power reflect genetic variance in gray and white matter volumes Twin research and human genetics. the official journal of the International Society for Twin Studies 2012; 15: pp. 384-392
- Steiger A., and Kimura M.: Wake and sleep EEG provide biomarkers in depression. J Psychiatr Res 2010; 44: pp. 242-252
- Steiger A., Pawlowski M., and Kimura M.: Sleep electroencephalography as a biomarker in depression. ChronoPhysiol Ther 2015; 5: pp. 15-25
- Tallon-Baudry C.: The roles of gamma-band oscillatory synchrony in human visual cognition. Front Biosci 2009; 14: pp. 321-332
- Tarokh L., Carskadon M.A., and Achermann P.: Developmental Changes in Brain Connectivity Assessed Using the Sleep. EEG Neuroscience 2010; 171: pp. 622-634
- Tarokh L., Carskadon M.A., and Achermann P.: Early Adolescent Cognitive Gains Are Marked by Increased Sleep EEG Coherence. PloS one 2014; 9:
- Tas C., Cebi M., Tan O., Hizli-Sayar G., Tarhan N., and Brown E.C.: EEG power, cordance and coherence differences between unipolar and bipolar depression. Journal of affective disorders 2015; 172: pp. 184-190
- Thatcher R.W., North D., and Biver C.: EEG and intelligence: relations between EEG coherence, EEG phase delay and power Clinical neurophysiology. official journal of the International Federation of Clinical Neurophysiology 2005; 116: pp. 2129-2141
- Thatcher R.W., North D.M., and Biver C.J.: Intelligence and EEG phase reset: a two compartmental model of phase shift and lock. NeuroImage 2008; 42: pp. 1639-1653
- Thatcher R.W., Walker R.A., and Giudice S.: Human cerebral hemispheres develop at different rates and ages. Science 1987; 236: pp. 1110-1113
- Tomasi D, Volkow ND (2012) Gender differences in brain functional connectivity density Human brain mapping 33:849-860
- Tsolaki A., Kazis D., Kompatsiaris I., Kosmidou V., and Tsolaki M.: Electroencephalogram and Alzheimer’s Disease: Clinical and Research Approaches. International Journal of Alzheimer’s Disease 2014 2014; undefined: pp. 10
- Uhlhaas P.J., and Singer W.: Abnormal neural oscillations and synchrony in schizophrenia. Nat Rev Neurosci 2010; 11: pp. 100-113
- Ujma PP (2018) Sleep spindles and general cognitive ability–A meta-analysis Sleep Spindles & Cortical Up States:1-17
- Ujma P.P., et al: A comparison of two sleep spindle detection methods based on all night averages: individually adjusted versus fixed frequencies. Frontiers in Human Neuroscience 2015; 9:
- Ujma P.P., et al: Sleep spindles and intelligence: evidence for a sexual dimorphism The. Journal of neuroscience : the official journal of the Society for Neuroscience 2014; 34: pp. 16358-16368
- Ujma P.P., et al: The sleep EEG spectrum is a sexually dimorphic. marker of general intelligence Scientific reports 2017; 7: pp. 18070
- Ujma P.P., Sandor P., Szakadat S., Gombos F., and Bodizs R.: Sleep spindles and intelligence in early childhood-developmental and trait-dependent aspects. Dev Psychol 2016; 52: pp. 2118-2129
- Venkatasubramanian G., and Keshavan M.S.: Biomarkers in Psychiatry – A Critique. Annals of Neurosciences 2016; 23: pp. 3-5
- Vijayan S., Lepage K.Q., Kopell N.J., and Cash S.S.: Frontal beta-theta network during REM sleep. eLife 2017; 6:
- Vinck M., Oostenveld R., van Wingerden M., Battaglia F., and Pennartz C.M.: An improved index of phase-synchronization for electrophysiological data in the presence of volume-conduction. noise and sample-size bias NeuroImage 2011; 55: pp. 1548-1565
- Vysata O., Kukal J., Prochazka A., Pazdera L., Simko J., and Valis M.: Age-related changes in EEG coherence. Neurol Neurochir Pol 2014; 48: pp. 35-38
- Wurtman R (2015) Biomarkers in the diagnosis and management of Alzheimer’s disease Metabolism 64:30
- Yap Q.J., Teh I., Fusar-Poli P., Sum M.Y., Kuswanto C., and Sim K.: Tracking cerebral white matter changes across the lifespan: insights from diffusion tensor imaging studies. J Neural Transm 2013; 120: pp. 1369-1395
- Yeragani V.K., Cashmere D., Miewald J., Tancer M., and Keshavan M.S.: Decreased coherence in higher frequency ranges (beta and gamma) between central and frontal EEG in patients with schizophrenia: A preliminary report. Psychiatry research 2006; 141: pp. 53-60
Neurobiology of Aging, Copyright © 2019