Physiology & Behaviour 130 (2014) 149-156
DOI: 10.1016/j.physbeh.2014.04.004
Anna Kisa,b,⁎,1, Sára Szakadáta,c,d,⁎⁎,1, Enikő Kovácsa, Márta Gácsie, Péter Simorc,f, Ferenc Gombosg, József Topálb, Ádám Miklósia,e, Róbert Bódizsd,g
a Department of Ethology, Eötvös University, H-1117 Pázmány P. stny. 1/c, Budapest, Hungary
b Research Centre for Natural Sciences, Hungarian Academy of Sciences, H-1117 Magyar tudósok krt. 2, Budapest, Hungary
c Department of Cognitive Science, Budapest University of Technology and Economics, H-1111 Egry József u. 1, Budapest, Hungary
d Institute of Behavioural Sciences, Semmelweis University, H-1089 Nagyvárad tér 4, Budapest, Hungary
e MTA-ELTE Comparative Ethology Research Group, H-1117 Pázmány P. stny. 1/c, Budapest, Hungary
f Nyírő Gyula Hospital National Institute of Psychiatry and Addictions, H-1135 Lehel u. 59, Budapest, Hungary
g Department of General Psychology, Pázmány Péter Catholic University, H-2087 Egyetem u. 1, Piliscsaba, Hungary
⁎ Correspondence to: A. Kis, Department of Ethology Eötvös University, H-1117 Pázmány P. stny. 1/c Budapest, Hungary. Tel.: +36 1 3812179; fax: +36 1 3812180. ⁎⁎ Correspondence to: S. Szakadát, Department of Ethology Eötvös University, H-1117 Pázmány P. stny. 1/c, Budapest, Hungary. E-mail addresses: vargane.kis.anna@ttk.mta.hu (A. Kis), szurtrikk@gmail.com (S. Szakadát). 1 These two authors have contributed equally to this work.
Abstract
Recently dogs (Canis familiaris) have been demonstrated to be a promising model species for studying human behavior as they have adapted to the human niche and developed human-like socio-cognitive skills. Research on dog behavior, however, has so far almost exclusively focused on awake functioning. Here we present a self-developed non-invasive canine polysomnography method that can easily be applied to naive pet dogs. N = 22 adult pet dogs (with their owners present) and N = 12 adult humans participated in Study I. From these subjects, N = 7 dogs returned on two more occasions for Study II. In Study I, we give a descriptive analysis of the sleep electroencephalogram of the dog and compare it to human data. In order to validate our canine polysomnography method in Study II, we compare the sleep macrostructure and the EEG spectrum of dogs after a behaviorally active day without sleep versus passive day with sleep. In Study I, we found that dogs’ sleep EEG resembled that of human subjects and was generally in accordance with previous literature using invasive technology. In Study II, we show that similarly to previous results on humans daytime load of novel experiences and sleep deprivation affects the macrostructural and spectral aspects of subsequent sleep. Our results validate the family dog as a model species for studying the effects of pre-sleep activities on the EEG pattern under natural conditions and, thus, broaden the perspectives of the rapidly growing fields of canine cognition and sleep research.
- Introduction
Although the intertwined nature of sleep and awake states is widely accepted, there is still no unifying and quantitative theory of sleep, and its universal role in information processing across species is also debated [16]. The investigation of mammalian sleep within a comparative framework and a unified methodology would thus be indispensable. The dog (Canis familiaris) has been proposed to be a promising model species for studying the evolution of human cognition by the means of a comparative method [8,14] because it has adapted to the human niche and developed human-analogue socio-cognitive skills. However, research on dog behavior has so far focused almost exclusively on awake functioning. Recent advances in the field have attempted to complement behavioral data with recording dog electroencephalogram in order to study awake brain activity, but these techniques were either minimally invasive (used needle electrodes: [10,11]) or required extensive prior training (1.5 years: [12,19]). The non-invasive canine polysomnography method we describe here can be easily applied to naive pet dogs and, thus, enables the study of the dog as a new natural model of sleep research. As the method has been developed following the recording technique used in human studies, it also allows for a more direct comparison to human data, as compared to rodent experiments.
2. Ethic statement
No special permission for use of pet dogs in such non-invasive studies is required in Hungary. The relevant committee that allows conducting research without special permissions regarding animals is the University Institutional Animal Care and Use Committee (UIACUC, Eötvös Loránd University, Hungary). All owners volunteered to participate in the study. The person shown in the Fig. 1a gave written consent to the publication of the photo. The human study protocol was approved by the Ethical Committee of the Semmelweis University. Subjects volunteered to participate without monetary compensation and provided informed consent before the onset of the experiment.
3. Study I
3.1. Methods
Our subjects were N = 22 privately owned adult (1–8 years old) pet dogs (9 males, 13 females) from 8 different breeds (5 Border Collies, 4 Golden Retrievers, 1 Belgian Shepherd, 1 Border Terrier, 1 Labrador Retriever, 1 Miniature Schnauzer, 1 Puli) and 8 mongrels with highly variable head shape and size (7–32 kg of weight). There were no specific requirements for participation except that dogs had to be older than 1 year. As a reference group, 12 young adult (23–34 years old, mean age: 26.92 ± 3.00) human subjects were also included in the study (5 men, 7 women). All subjects participated in a 3-h-long sleeping occasion (an afternoon napping). The timing of the recording could vary depending on the preferences of the participating dog owners and human subjects but was restricted to the period between 12 pm and 6 pm as (apart from nighttime) dogs, similarly to humans, show the highest propensity to sleep during the afternoon [17]. The sleep laboratory was equipped as an ordinary room in the Department of Ethology, ELTE, Budapest. There was a mattress on the floor with a blanket next to it. Owners could decide whether they preferred their dog to sleep on the mattress with them or on the floor next to them. Windows in the room were covered with curtains to provide constant light conditions. In case of the canine subjects after a 5–10 minute exploration and familiarization period, the owner took place on the mattress and assisted the two experimenters throughout the process of fixing surface attached electrodes onto the dog. The dog was rewarded with food during electrode placement if the owner deemed it necessary; social reinforcement (praise, petting) was used in all cases. While the dog was resting or sleeping, the owner watched a movie with an earphone and was asked to stay quiet and still in the mattress (Fig. 1a). Similarly to the canine subjects, after a 5–10 minute familiarization period human participants were asked to take place on the mattress for the process of fixing surface attached electrodes on them. Sleep was monitored by polysomnography (PSG) that allows the parallel recording of several physiological variables—such as neural oscillations (EEG), eye movements (EOG), muscle tone and movements (EMG), heart rhythm (ECG) and respiration patterns—during sleep. The canine PSG technique was developed following the methodology of human PSG studies. Prior to the acceptance of the final design, we conducted pilot studies on 3 dogs (7–9 years old; 1 Belgian shepherd, 1 sheltie, 1 mongrel; all males) to find the most efficient setup and placement of the electrodes. When all of our a priori articulated criteria (production of clear and interpretable signal; impedances below 15 kΩ; both NREM and REM phase during the recording interval) were met, our PSG design (Fig. 1b) was accepted and applied identically for both dogs and humans. Surface attached scalp electrodes were placed over the anteroposterior midline of the skull (Fz, Cz)—similarly to the study of [10]—and on the zygomatic arch (os zygomaticum) next to the left eye (O) for electrooculography (EOG). The ground electrode (G) was placed on the left musculus temporalis, the Cz electrode served as reference. All EEG and EOG electrodes were placed on a bone for both dogs and humans so artifacts resulting from muscle movements were minimal. Electrodes were placed bilaterally on the musculus iliocostalis dorsi for electromyography (EMG) and over the second rib for electrocardiography (ECG). Respiratory movements were also monitored by a respiratory belt attached to the chest. Gold-coated Ag/AgCl electrodes fixed with EC2 Grass Electrode Cream (Grass Technologies, USA) were used for the recordings. Impedances for the EEG electrodes were kept below 15 kΩ for dogs and below 10 kΩ for humans. Signals were collected, prefiltered, amplified and digitized at a sampling rate of 249 Hz/channel by using the 30-channel Flat Style SLEEP La Mont Headbox with implemented second order filters at 0.5 Hz (high pass) and 70 Hz (low pass) as well as the HBX32-SLP 32 channel preamplifier (La Mont Medical Inc., USA). Sleep recordings of both dog and human subjects were visually scored by two experienced sleep researchers (AK, SS) according to
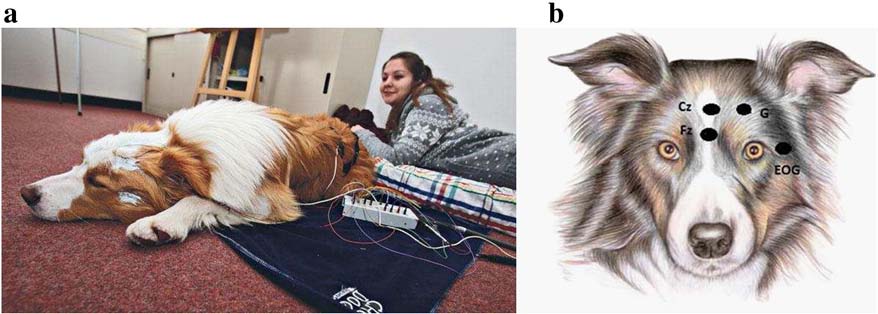 Fig. 1. Photograph of the recording setup (a) and schematic drawing of the electrode placement (b). The photograph was taken by BLIKK (permission obtained from Marcell Murányi).
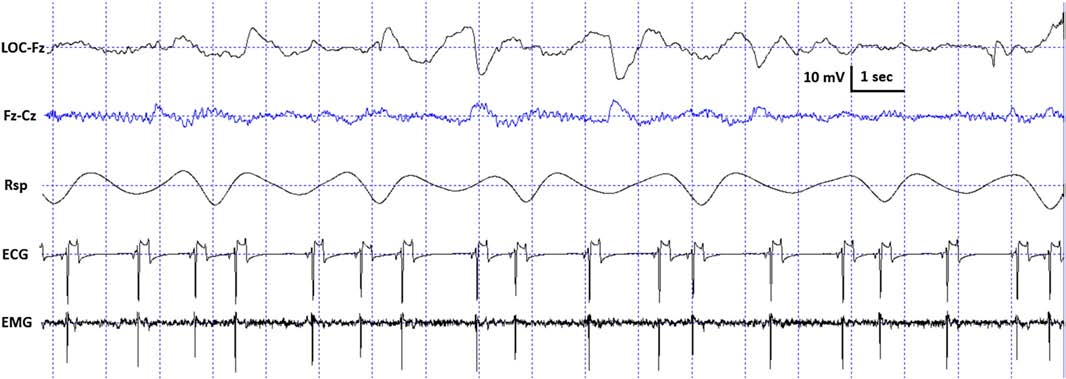
Fig. 2. Characteristic polysomnographic view of dogs’ drowsiness. The EEG channel (Fz–Cz derivation) is characterized by fast activity accompanied by decreased amplitude and frequency eye movements in the EOG (LOC–Fz derivation), lowered but observable muscle tone (EMG channel) as well as fairly regular respiration (Rsp channel) and heart beat (ECG).
standard criteria [15,20]. In case of both dogs and humans, the wakefulness stage was defined as the occurrence of fast activity in the EEG (Fz–Cz derivation), high amplitude and frequency eye movements in the EOG (LOC–Cz derivation), elevated muscle tone and frequent movements (EMG channel). For dogs, drowsiness was defined as fast EEG activity in the EEG channel (Fz–Cz derivation) accompanied by decreased amplitude and frequency eye movements in the EOG (LOC–Fz derivation), lowered but observable muscle tone (EMG channel) and fairly regular respiration (Rsp channel) (Fig. 2). For humans, Stage 1 sleep was defined as the absence of alpha (8–12 Hz) waves and sleep spindles (see SWS for comparison) with the possible occurrence of vertexes (narrow–brief–and focal waves with an amplitude of 50–150 μV) in the EEG (Fz–Cz derivation), no or low amplitude eye movements in the EOG (LOC–Fz derivation), relatively regular respiration (Rsp channel) and decreased muscle tone (EMG channel). Slow wave sleep (SWS) for both dogs and humans was defined as the occurrence of ≥15 μV delta (1–4 Hz) activity and/or sleep spindles (waves with 12– 16 Hz frequency and ≥ 0.5 s duration) in the EEG (Fz–Cz derivation), no or low amplitude eye movements in the EOG (LOC–Fz derivation), relatively regular respiration (Rsp channel) and decreased muscle tone (EMG channel) (Fig. 3). REM sleep was defined for both dogs and humans as the occurrence of rapid eye movements in the EOG (LOC–Fz derivation)—also seen as artifacts in the EEG (Fz–Cz derivation)—fast EEG activity (Fz–Cz derivation), muscular atonia (EMG channel), irregular respiration (Rsp channel) and heart beat (ECG) (Fig. 4). Inter-rater reliability (Cohen’s κ) was calculated based on double scoring of 5 dog and 3 human recordings (10 randomly chosen epochs/recording) and was found to be “Almost perfect” for both dogs (κ = 0.90) and humans (κ = 0.87) according to the categorization of [13]. A program developed by our laboratory (Fercio, © Ferenc Gombos 2012) was used to export the following macrostructural variables: sleep latency (time elapsed until the first non-drowsiness sleep, min), sleep efficiency (ratio of time spent asleep to the total length of the recording, %), drowsiness/S1 duration (for dogs/humans respectively, min), SWS duration (min), REM duration (min) and sleep cycle duration (min). A descriptive analysis was conducted on these macrostructural variables (mean ± SD, minimum and maximum values). Artifact rejection was carried out manually on 4-s epochs before further automatic analyses. Average power spectral densities (1 Hz to 30 Hz) were calculated by a mixed-radix Fast Fourier Transformation (FFT) algorithm applied to the 50% overlapping, Hanning-tapered 4-s windows of the EEG signal of the Fz–Cz derivation using the DADiSP program (DSP Development Corp. USA). Relative spectral power values were obtained for each frequency bin (width: 0.25 Hz) by dividing the absolute power of the given frequency bin with the total spectral power (the
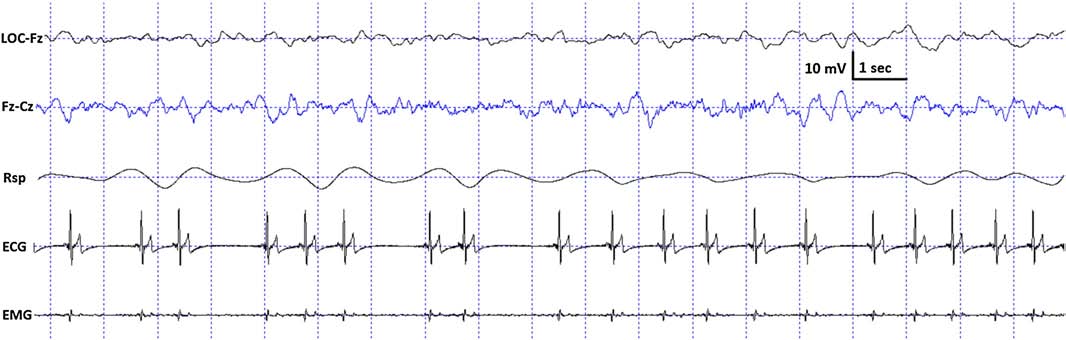
Fig. 3. Characteristic polysomnographic view of dogs’ slow wave sleep. The EEG (Fz–Cz derivation) was characterized by the occurrence of ≥15 μV delta (1–4 Hz) activity and/or sleep spindles (waves with 12–16 Hz frequency and ≥0.5 s duration), accompanied by no or low amplitude eye movements in the EOG (LOC–Fz derivation), relatively regular respiration (Rsp channel) and heart beat (ECG) as well as decreased muscle tone (EMG channel).

Fig. 4. Characteristic polysomnographic view of dogs’ REM sleep. The EOG (LOC–Fz derivation) was characterized by the occurrence of rapid eye movements—also seen as artifacts in the EEG (Fz–Cz derivation)—fast EEG activity (Fz–Cz derivation), muscular atonia (EMG channel), irregular respiration (Rsp channel) and heart beat (ECG).
sum of the absolute power of the whole range of analysis between 1 and 30 Hz). The relative power values reflect the relative contribution of a given frequency range to the total spectrum. The relative spectra for the different vigilance states are provided in Fig. 5. Comparisons of the sleep stages (wake + drowsiness/S1, SWS, REM sleep) in each frequency bin were performed using analysis of variance (ANOVA). In order to address the issue of multiple comparisons, we used the procedure of descriptive data analysis delineating the so-called Rüger’s areas [1]. Rüger’s areas are defined as sets of conventionally significant (p b 0.05) results, which are accepted or rejected as significant as a whole, instead of individual results of statistical tests. Taking the results of the statistical tests as a matrix, we defined Rüger’s areas along the dimension of frequency bins. Starting from the lower frequencies, a Rüger’s area is the range of all the neighboring, consecutive frequency bins which contain a significant result surrounded by bins containing non-significant results. After defining these areas of significance, the number of significant results within the area was calculated, and it was investigated whether at least half of these results were significant at least at 1/2 of the conventional p = 0.05 significance level (that is, whether they were below 0.025) and at least one third of them were significant at least at 1/3 of the conventional p = 0.05 significance level (that is, whether they were below 0.0167). If both of these conditions were fulfilled, the area as a whole was considered significant. With this method, a single significant statistical test with p b 0.0167 theoretically counts as a significant Rüger’s area; however, we would not have considered single-bin results as an area (although there were none).
3.2. Results
In line with previous studies using invasive methodology [17], dogs showed polyphasic sleep with frequent shifts between different
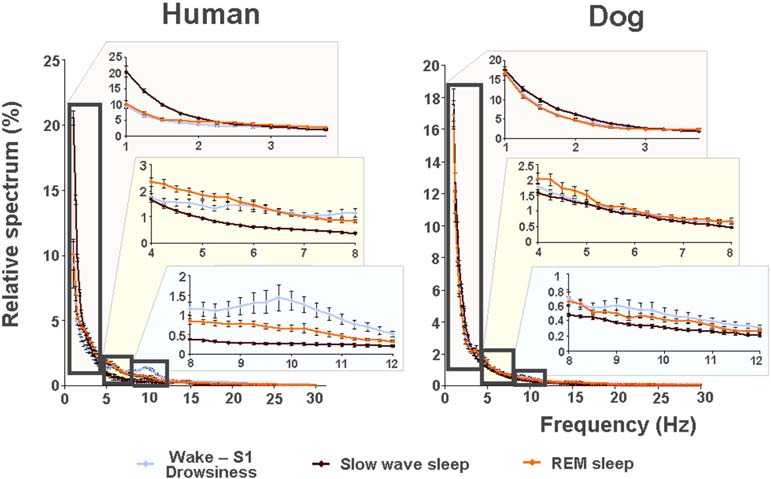
Fig. 5. Relative power spectra of drowsiness, slow wave sleep and REM sleep in human (on the left) and dog (on the right) sleep in the frequency range of 1–30 Hz. Comparisons of the sleep stages show that drowsiness in dogs is characterized by increased high-frequency (alpha: 8.75–12.25 Hz and beta: 12.75–30 Hz) activity, SWS sleep is characterized by increased low frequency (delta, 1.5–3 Hz) activity and REM sleep is characterized by increased theta (4.25–4.5 and 7–8 Hz) activity; similarly in humans, calm awake + S1 is characterized by increased high-frequency (alpha: 8.75–12.75 Hz and beta: 15–30 Hz) activity, SWS sleep is characterized by increased low frequency (delta: 1–2.75 Hz) activity and REM sleep is characterized by increased theta (3.5–4.5 Hz) activity.
vigilance states, including the wakeful state. Furthermore, a high interindividual variation could be observed in case of all variables, for instance sleep efficiency (the ratio of time spent asleep to the total length of the recording) ranged from 7.7% to 81.4% in case of dogs (42.7 ± 23.3) and from 0.9% to 92.9% in humans (70.4 ± 32.2) (Table 1). Dogs’ sleep EEG spectrum resembled that of human subjects and was generally in accordance with previous literature using invasive technology [20]. Namely, drowsiness in dogs and calm awake + S1 in humans was characterized by an increased activity in the high-frequency (alpha, beta) range, while in both dogs and humans SWS was characterized by an increased activity in the low frequency (delta) range and REM sleep was characterized by an increased activity in the theta range compared to the other sleep stages (Fig. 5). Furthermore, dogs’ age was related to the spectral features of the sleep EEG, paralleling previous findings on humans [5] (Pearson correlations), with older dogs showing a decrease in relative delta power during SWS (r = − 0.515, p = 0.029) and REM sleep (r = −0.732, p = 0.003) and an increase in relative alpha (SWS: r = 0.530, p =0.024, REM: r = 0.716, p = 0.004) and beta (SWS: r = 0.540, p = 0.021, REM: r = 0.743, p = 0.002) power (Fig. 6). Correlations with age were not tested in case of human participants as they were from a narrow age range.
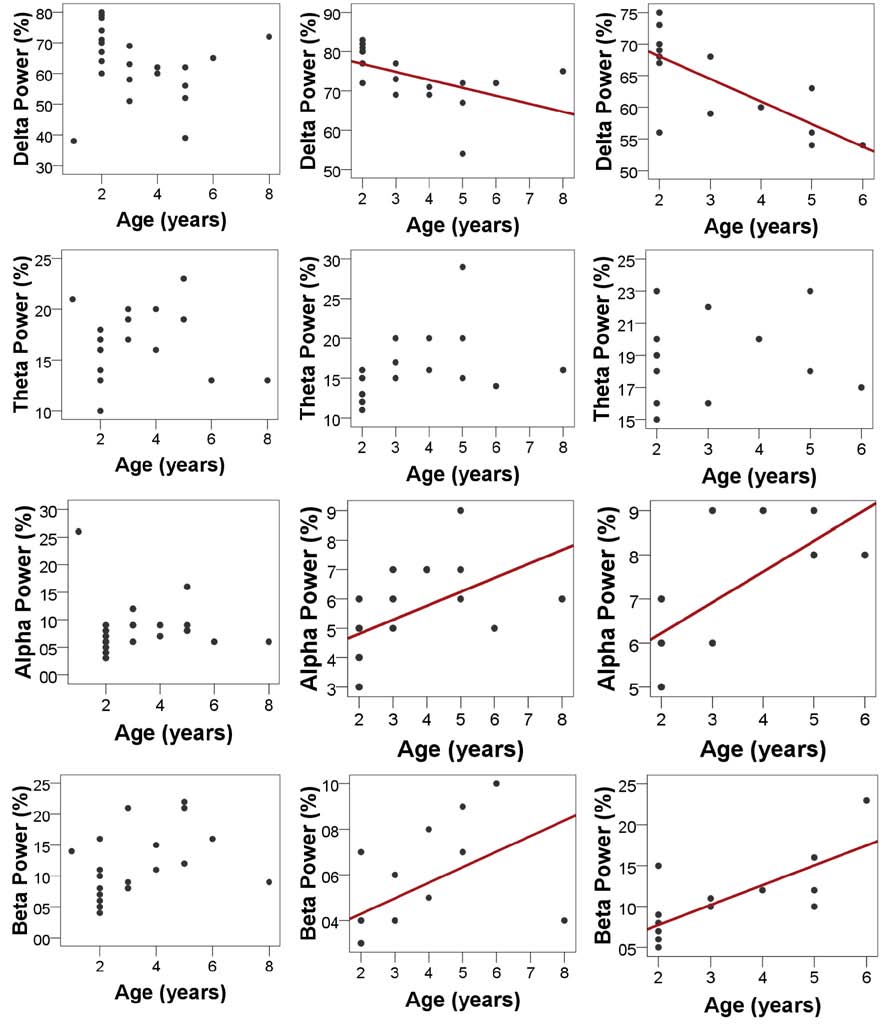
Fig. 6. Relatedness of dogs’ age and spectral features of the EEG in the different sleep stages. Older dogs show a decrease in relative delta power during SWS (r = −0.515, p = 0.029) and REM sleep (r = −0.732, p = 0.003), but not during drowsiness (r = −0.161, p = 0.474) and an increase in relative alpha (SWS: r = 0.530, p = 0.024, REM: r = 0.716, p = 0.004, but not drowsiness: r = −0.092, p = 0.068) and beta (SWS: r = 0.540, p = 0.021, REM: r = 0.743, p = 0.002, but not drowsiness: r = 0.381, p = 0.080) power; no correlations were found in the theta range (drowsiness: r = 0.070, p = 0.758, SWS: r = 0.402, p = 0.098, REM: r = 0.276, p = 0.340). Regression lines are displayed for significant correlations only. Note that some of the subjects had no SWS and/or REM sleep thus the sample sizes and age ranges vary among sleep stages.
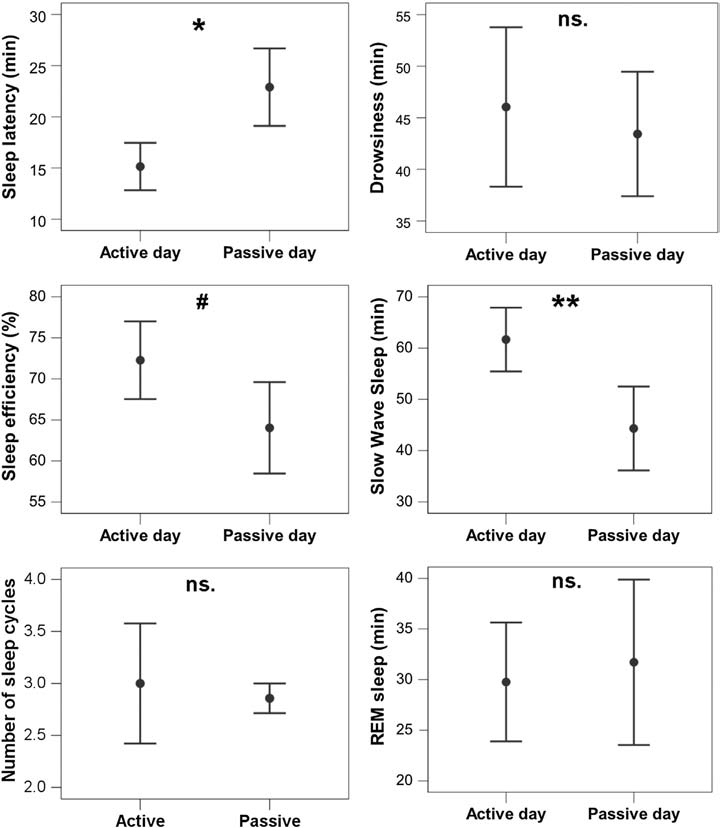
Fig. 7. Sleep EEG differences after an active and a passive day were reflected in sleep macrostructure, as shown by a sample hypnogram from one of the subjects.

Fig. 8. Differences in sleep macrostructure between the active and the passive day. **p b 0.01, *p b 0.05, # p b 0.1; ns: p N 0.1. Sleep latency was shortened after an active day (χ2(1) =4.665, p = 0.031; no order effect (2nd or 3rd occasion, χ2(1) = 0.303, p = 0.582) or interaction among the two factors (χ2(1) = 0.000, p = 0.990) could be observed). Sleep efficiency (%) was only marginally affected by a preceding active/passive day (χ2(1) = 2.998, p = 0.083 and no order effect (2nd or 3rd occasion, χ2(1) = 0.003, p = 0.953) or interaction among the two factors (χ2(1) = 0.427, p = 0.514) could be observed). This was probably due to the fact that drowsiness duration (χ2(1) = 0.409, p = 0.523) and REM duration (χ2(1) = 0.041, p =0.840) did not differ among active and passive day. (Also no order effect (2nd or 3rd occasion, drowsiness: χ2(1) = 0.245, p = 0.625; REM: χ2(1) = 0.627, p =0.429) or interaction among the two factors (drowsiness: χ2(1) = 1.255, p = 0.263; REM: χ2(1) = 1.141, p = 0.285) could be observed.) However, just like in a similar human study [9], the amount of slow wave sleep was higher following an active day (χ2(1) = 6.829, p = 0.009; no order effect (2nd or 3rd occasion, χ2(1) = 0.489, p = 0.484) or interaction among the two factors (χ2(1) = 1.502, p =0.220) could be observed). The number of sleep cycles was also not affected by a preceding active/passive day (χ2(1) = 0.085, p = 0.770; no order effect (2nd or 3rd occasion, χ2(1) =0.085, p = 0.771) or interaction among the two factors (χ2(1) = 0.464, p = 0.496) could be observed).
the dogs did not fall asleep. Additional (1–2 h long) activities included training (N = 2) and playing with the owner (with a ball: N = 2 or with a Frisbee: N = 1). During the passive day, all dogs stayed at home (N = 6) or at the owner’s workplace (N = 1) for at least 6 h prior to the experiment, and all owners reported that the dogs spent some time asleep. During transportation to the department (by car: N = 1, with public transport: N = 6), the dogs were also allowed to sleep. The maximum difference between the starting time of the two nappings for the same individual was 1 h, and the active and the passive conditions had to be either both during the week or both at the weekend. Although there are certain methodological shortcomings of this experimental design manifested in many uncontrolled variables of the behaviorally active day (such as the type of new experiences, amount and intensity of exercise or social interactions) our intention was to sleep deprive our subjects and present them with a set of novel experiences and interactions that would yield robust changes in the quality of subsequent sleep. After hypnogram scoring (for an illustrative example, see Fig. 7), a generalized estimating equation was used to test the effects of two factors (“active vs. passive day” and “2nd or 3rd sleeping occasion”) on the macrostructural data as dependent variables in a within subject design. The relative power spectrum of the EEG signal of the Fz–Cz derivation was calculated separately for the three vigilance states in the frequency ranges of delta (1–4 Hz), theta (4–8 Hz), alpha (8–12 Hz) and beta (12– 30 Hz) known from human and rat sleep studies [6] and also previously used in laboratory dogs [20]. Paired sample t tests were used to compare the spectral features of the sleep EEG after a behaviorally active vs. passive day (with Benjamini false discovery rate correction: [3]). All statistical tests were carried out with SPSS18 (IBM USA).
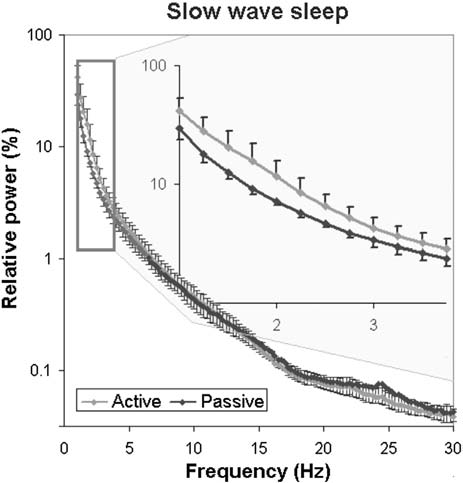
Fig. 9. Sleep EEG differences after an active and a passive day were reflected in the relative EEG spectrum especially in the delta (1–4 Hz) frequency range during slow wave sleep.
- Study II
4.1. Method
To validate our canine polysomnography method described above, we investigated whether increased load of novel experiences and mild sleep deprivation during the day have effects on subsequent sleep as predicted by the synaptic homeostasis hypothesis [18] and other theories supporting the information processing role of sleep [7,9] put forward in the human literature. From the dog subjects that participated in the above study, N = 7 (age: 2–4 years; 2 males, 5 females; 2 Border collies, 1 golden retriever and 4 mongrels; 15–34 kg of weight) returned on two more occasions (an active day and a passive day condition, in a counterbalanced order) in the afternoon between 1 pm and 6 pm. As these were the 2nd and 3rd sleep recordings for all subjects, they were already familiarized with the laboratory setting and the environment, thus the risk of an order effect (also known from the human literature [2] as the first-night effect) affecting our results was minimal. In the active day, subjects were requested to engage in 6–8 h of sleepless activity, including locomotion and social interactions such as going for a walk/excursion, attending a dog training school, etc. In the passive day, subjects were requested to spend a usual day at home with the owner involving the least social interaction possible. The active day included for all subjects 4 to 6 h walking (in the city: N = 3 or in the forest: N = 4, out of these N = 1 subject was walking with a group of other dogs) and approximately half an hour transportation to the department (by car: N = 1, with public transport: N = 6), during which the owners ensured that
4.2 Results
In accordance with previous studies on the effect of sleep deprivation [4] and experience [9] in humans, the generalized estimating equation revealed that the macrostructure of dogs’ sleep differed between the active and the passive days in several aspects (Fig. 8), while no order effects (2nd or 3rd occasion, all p N 0.1) or interaction among the two factors (all p N 0.1) could be observed. Sleep latency was shortened after an active day (χ2(1) = 4.665, p = 0.031). Sleep efficiency (%) was only marginally affected by condition type (active/passive day, χ2(1) = 2.998, p = 0.083). This was probably due to the fact that drowsiness duration (χ2(1) = 0.409, p = 0.523) and REM duration (χ2(1) = 0.041, p = 0.840) did not differ among active and passive days. However, the amount of slow wave sleep was higher following an active day (χ2(1) = 6.829, p = 0.009). The number of sleep cycles was also not affected by a preceding active/passive day (χ2(1) = 0.085, p = 0.770). In line with previous human studies [4], the spectral features of dogs’ sleep differed between the behaviorally active (sleep deprived) and passive (not sleep deprived) days: after correction for multiple comparisons (Benjamini false discovery rate adjustment [3]), we found that following the active day alpha (8–12 Hz) activity decreased (t(6) = 2.760, p = 0.033) during drowsiness, while during SWS delta (1–4 Hz) activity increased (t(6) = 3.173, p = 0.019; Fig. 9) and alpha (8–12 Hz; t(6) = 2.866, p = 0.029)
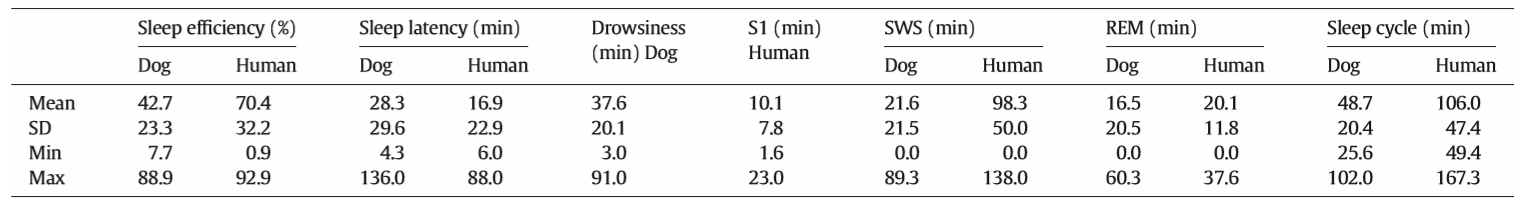
Table 1 Descriptive results of sleep macrostructure for dog and human subjects. Sleep efficiency is the ratio of time spent asleep (total drowsiness/S1, SWS and REM sleep time) to the length of the recording (in this case 3 h). Sleep latency was defined as the minutes elapsed until the first non-drowsiness sleep. Descriptive data of sleep cycle duration is based on the recordings of 15 canine subjects and 10 human subjects as 7 dogs and 2 humans had no SWS and/or REM sleep during the recording.
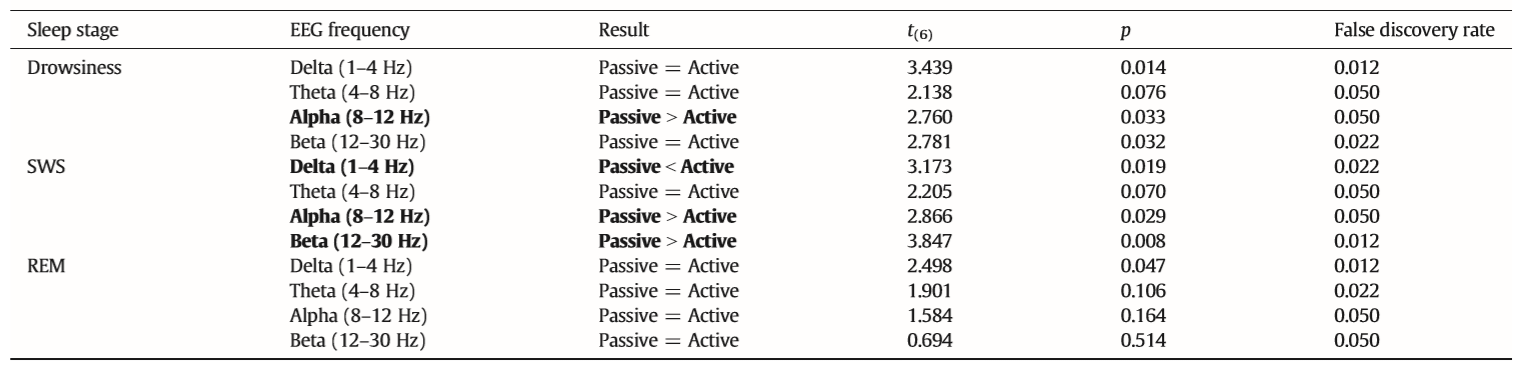
Table 2 Differences in the spectral features (relative EEG power) of sleep between the active and the passive day. Differences that remain significant after false discovery rate correction are marked with bold.
and beta (12–30 Hz; t(6) = 2.847, p = 0.008) activity decreased; there were no significant differences during REM sleep (Table 2).
5. Discussion
Our newly developed canine polysomnography technique yielded comparable results to both data from human [9] and mammalian [17] sleep studies. This methodological development represents a significant advance in the fields of both sleep and canine cognition research providing an easily applicable and non-invasive method to study neural oscillations of the dog. Our design allowed us to compare the macrostructure and EEG spectrum of sleep in different conditions and revealed experience- and sleep deprivation-dependent changes in dogs’ sleep. Furthermore, the high inter-individual variation we observed opens the way for investigating the correlates of different information processing mechanisms and other underlying variations (e.g. age of the subjects, as shown in the present study). In summary, our results validate the family dog as a model species for studying the effects of pre-sleep activities on EEG pattern under natural conditions and thus broaden the perspectives of the rapidly growing field of canine cognition research. Conflict of interest The authors declare that no competing interests exist.
Acknowledgements
We thank Szilvia Csóka and her dog Bogrács for their pioneering work that inspired this project.
Financial support was provided by the Hungarian Academy of Sciences (MTA 01 031) and the Hungarian Scientific Research Fund (K100695). The founders had no role in the design, analysis and interpretation of the data.
References
[1] Abt K. Descriptive data analysis: a concept between confirmatory and exploratory data analysis. Methods Inf Med 1987;26(2):77–88.
[2] Agnew HW, Webb WB, Williams RL. The first night effect: an EEG study of sleep. Psychophysiology 1966;2(3):263–6.
[3] Benjamini Y, Drai D, Elmer G, Kafkafi N, Golani I. Controlling the false discovery rate in behavior genetics research. Behav Brain Res 2001 Nov;125(1–2):279–84.
[4] Borbély AA, Baumann F, Brandeis D, Strauch I, Lehmann D. Sleep deprivation: effect on sleep stges and EEG power density in man. Electroencephalogr Clin Neurophysiol 1981;51:483–93.
[5] Carrier J, Land S, Buysse DJ, Kupfer DJ, Monk TH. The effects of age and gender on sleep EEG power spectral density in the middle years of life (ages 20–60 years old). Psychophysiology 2001;38(2):232–42.
[6] Colrain IM. Sleep and the brain. Neuropsychol Rev 2011;21(1):1–4.
[7] Diekelmann S, Born J. The memory function of sleep. Nat Rev Neurosci 2010;11(2):114–26.
[8] Hare B, Brown M, Williamson C, Tomasello M. The domestication of social cognition in dogs. Science 2002;298(5598):1634-1636.
[9] Horne JA, Minard A. Sleep and sleepiness following a behaviourally “active” day. Ergonomics 1985;28(3):567–75.
[10] Howell TJ, Conduit R, Toukhsati S, Bennett P. Development of a minimally-invasive protocol for recording mismatch negativity (MMN) in the dog (Canis familiaris) using electroencephalography (EEG). J Neurosci Methods 2011;201(2):377–80.
[11] Howell TJ, Conduit R, Toukhsati S, Bennett P. Auditory stimulus discrimination recorded in dogs, as indicated by mismatch negativity (MMN). Behav Processes 2012;89(1):8–13.
[12] Kujala MV, Törnqvist H, Somppi S, Hänninen L, Krause CM, Vainio O, et al. Reactivity of dogs’ brain oscillations to visual stimuli measured with non-invasive electroencephalography. PLoS One 2013;8(5):e61818.
[13] Landis JR, Koch GG. The measurement of observer agreement for categorical data. Biometrics 1977;33(1):159–74.
[14] Miklósi Á, Topál J. What does it take to become “best friends”? Evolutionary changes in canine social competence. Trends Cogn Sci 2013;17(6):287–94.
[15] Rechtschaffen A, Kales A. A manual of standardized terminology, techniques and scoring systemfor sleep stages of human subjects; 1968 (UCLA Brain Information Service, Brain Research Institute, Los Angeles).
[16] Siegel JM. Sleep viewed as a state of adaptive inactivity. Nat Rev Neurosci 2009;10:747–53.
[17] Takahashi Y, Ebihara S, Nakamura Y, Nishi C, Takahashi K. Circadian sleep and waking patterns in the laboratory dog. Sleep Res 1972;1:144.
[18] Tononi G, Cirelli C. Sleep function and synaptic homeostasis. Sleep Med Rev 2006;10(1):49–62.
[19] Törnqvist H, Kujala M, Somppi S, Hanninen L, Pastell M, Krause CM, et al. Visual event-related potentials of dogs: a non-invasive electroencephalography study. Anim Cogn 2013;16(6):973–82.
[20] Wauquier A, Verheyen JL, Van Den Broeck WAE, Janssen PAJ. Visual and computerbased analysis of 24 h sleep-waking patterns in the dog. Electroencephalogr Clin Neuropsychol 1979;46:33–48.