|
†Laboratory of Neurochemistry and Experimental Medicine, Department of Neurology, Faculty of Health Sciences, Semmelweis University, National Institute of Psychiatry and Neurology, Huvosvolgyi ut 116, H-1021 Budapest, Hungary *Corresponding author. Tel.: 136-1-391-5407; fax: 136-1-391-5305. E-mail address: h13638bag@helka.iif.hu (G. Bagdy) Accepted 14 March 2002 Abstract:Parallel effects of a single injection of the 5-HT2 receptor antagonist ritanserin on EEG power spectra, sleep and motor activity were measured for a 20-h period in freely moving Sprague–Dawley rats. Ritanserin (0.3 mg/kg, i.p.), administered at light onset (passive phase), caused an immediate transient increase in the EEG power density in the low frequency range (0.25–6 Hz, mainly delta activity)and a depression in the high frequency range (27–30 Hz) accompanied by a decrease in vigilance and light slow wave sleep (SWS-1),intermediate stage of sleep and increase in deep slow wave sleep (SWS-2) compared to control treatment. All these effects were over 8 h after the injection. Twelve hours after the injection, at dark onset (active phase), there was a marked increase in vigilance and motor activity and decrease in SWS-1 and spindle frequency activity in the control animals, but all these changes were diminished by ritanserin treatment. These effects resulted in a significant relative increase in the intermediate band (peak: 12–15 Hz) of the EEG power spectra and thus, a relative increase in thalamo-cortical synchronization caused by ritanserin at dark onset. Because ritanserin is a selective 5-HT2 receptor antagonist, we conclude that under physiological conditions serotonin increases EEG desynchronization and produces an increase in vigilance level and motor activity by tonic activation of 5-HT2 receptors. This regulatory mechanism plays an important role in the waking process, and the appearances of its effects in the light and dark phase are markedly different. Keywords: 5-HT2 receptor; Ritanserin; Spectral analysis; EEG; Motor activity; Sleep; Circadian rhythm; Thalamo-cortical synchronization
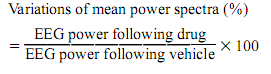
Ritanserin, a selective 5-hydroxytryptamine-2 (5-HT2)receptor antagonist, which has been shown to possess anxiolytic properties, massively enhances slow wave sleep (stage 3 and 4) in humans [4,5,12,13] and increases deep slow wave sleep (SWS-2) in rats [6,8,9,14]. There is some evidence that the light–dark cycle modulates the effect of ritanserin on sleep–wakefulness, thus, no major sleep alterations have been found when ritanserin was given at dark onset [9]. Spectral analysis of the electroencephalogram (EEG) by means of fast Fourier transformation (FFT) allows a more detailed description of the effects of drugs than conventional staging. Ritanserin and other 5-HT2 receptor antagonists increase low frequency EEG activity administered at the beginning of the passive phase, that is in the light period in rats [2] and in the dark period in humans [7]. However, effects of 5-HT2 receptor antagonists on EEG power spectra, including more than one cycle (12 h), have not been studied. To investigate the possible long-term effects of ritanserin, we carried out a spectral analysis of the EEG accompanied by examination of sleep and motor activity for a 20-h period. Male Sprague–Dawley rats (240–280 g, Crl:CDRBR, Charles River, Hungary), maintained on a 12:12 h light–dark cycle (lights on: 09:00–21:00 h) with food and water available ad libitum, were chronically equipped with EEG and electromyogram (EMG) electrodes as described earlier [10]. Briefly, stainless steel screw electrodes were implanted epidurally over the left frontal cortex (L: 2.0 mm and A: 2 mm to bregma) and over the left parietal cortex (L: 2.0 mm and A: 2.0 mm to lambda) for fronto-parietal EEG recording. The ground electrode was placed over the cerebellum. After a 10-day recovery period in single cages in EEG room, the animals were attached to the polygraph by a flexible recording cable and an electric swivel, fixed above the cages, permitting free movement for the animals. The rats remained continuously connected to the EEG, and were habituated to these conditions and to the injections for at least five additional days. All animals received vehicle and one dose of ritanserin treatment in a random order (4 days between treatments).The solutions were injected in the first 5 min of thebeginning of the light period. Ritanserin (Research Biochemicals, Natick, MA, USA) was dissolved in 10% (2-hydroxypropyl)-beta-cyclodextrin (Fluka) solution. EEG, EMG and motor activity were recorded for 20 h starting at light onset. The signals were amplified (amplification factors approximately 5000 for EEG and motor activity, 20 000 for EMG, respectively), conditioned by analog filters (filtering: below 0.53 Hz and above 30 Hz a 6 dB/octave) and subjected to an analogue to digital conversion with a sampling rate of 64 Hz. The digitized signals were displayed on a PC monitor and stored on computer for further analysis. EEG power spectra were computed for consecutive 4-s epochs in the frequency range of 0.25–30 Hz (FFT routine, Hanning window; frequency resolution 0.25 Hz). Epochs with artifacts were discarded on the basis of the polygraph records. Adjacent 0.25 Hz bins were summed into 1 Hz bins, and those above 30 Hz were omitted. Bins are marked by their upper limits, thus, 2 Hz refers to 1.25–2.00 Hz. The values of 75 consecutive 4-s epochs were averaged to yield power density values for 5-min periods. Absolute power densities are not very suitable for visualization of drug effects, because the inter-individual variation is considerable and the absolute values of the lower frequencies are several orders of magnitude higher than those of the higher frequencies [7]. The drug-induced changes in EEG power spectra were therefore calculated as the ratio of mean power spectra obtained following the injection of drug versus the mean power spectra obtained following administration of vehicle:
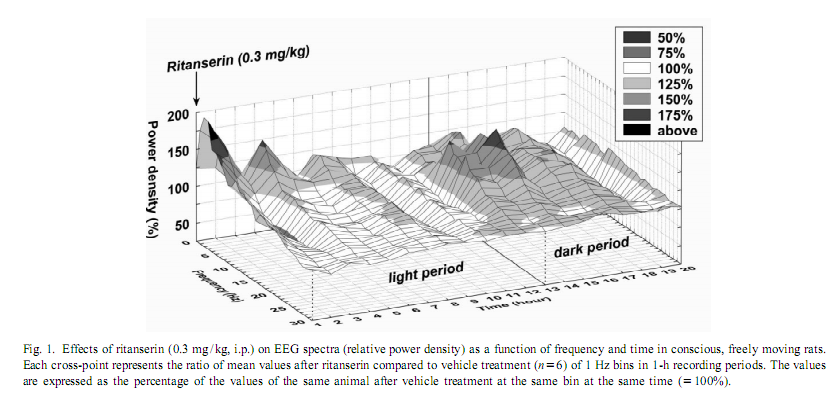
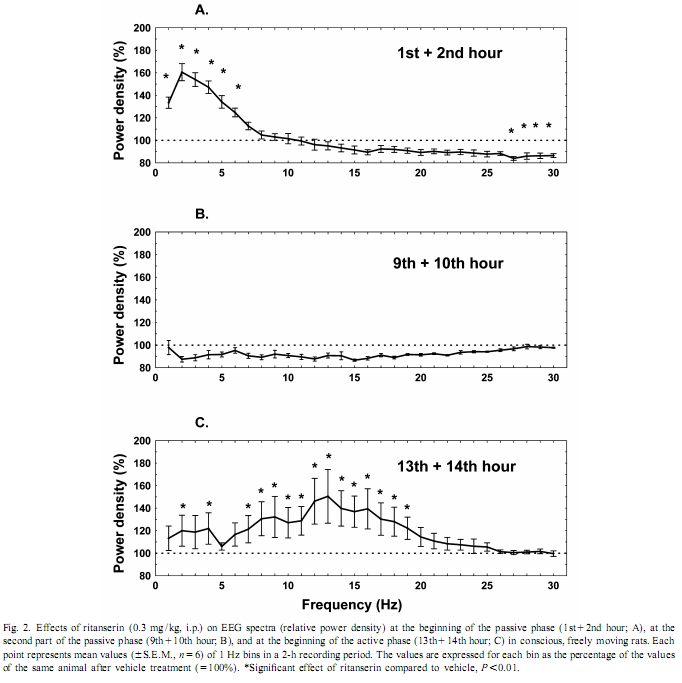
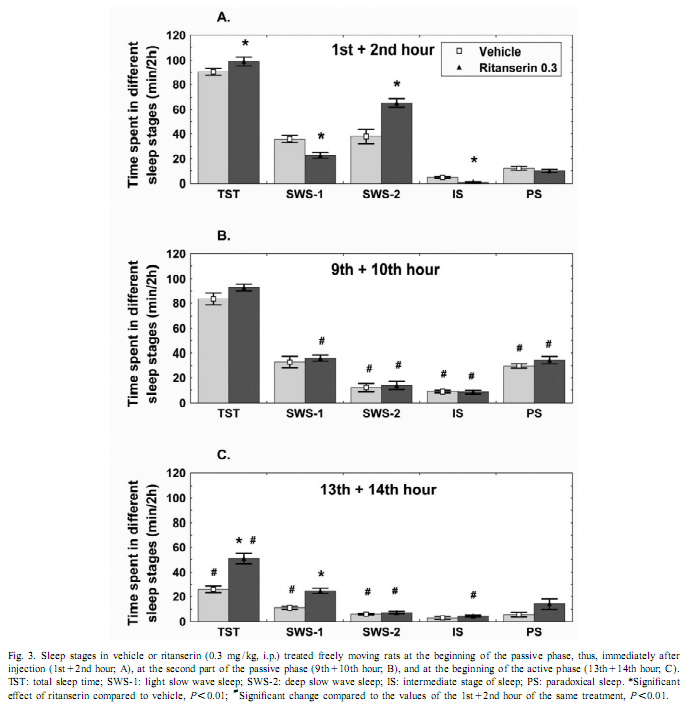
This procedure therefore allows for the change in EEG power, at each frequency, expressed as a percent of the original power, induced by a drug, compared with the control, in the same animal [17]. To investigate the amount of delta activity and of activity in the spindle frequency range (SFA) over time, adjacent 0.25 Hz bins of the EEG power spectra were integrated between 0.75 and 4 Hz and 12–15 Hz, respectively. The new time series, obtained in this way, were averaged to yield delta activity and SFA values for 2-h periods. To assess motor activity, the potentials generated by a small magnet attached to the cable connected to the animal were used and averaged for consecutive 4-s epochs [20]. If the values were beyond the maximal signal level during SWS-2 it was assigned as motor activity. The vigilance states were visually scored for 4-s periods.Wakefulness (W): the EEG is characterized by low amplitude activity at beta (14–30 Hz) and alpha (8–13 Hz)frequencies accompanied by high EMG and motor activity; light slow wave sleep (SWS-1): high voltage slow cortical waves (0.5–4 Hz) interrupted by low voltage fast EEG activity (spindles: 6–15 Hz) accompanied by reduced EMG and motor activity; deep slow wave sleep (SWS-2): continuous high amplitude slow cortical waves (0.5–4 Hz)with reduced EMG and motor activity; intermediate stage of sleep (IS): a short lasting stage (mean 3 s) just prior to paradoxical sleep and sometimes just after it characterized by unusual association of high-amplitude spindles (mean 12.5 Hz) and low-frequency (5.4 Hz) theta rhythm; paradoxical sleep (PS): low amplitude and high frequency EEG activity with regular theta waves (6–9 Hz) accompanied by silent EMG and motor activity with occasional twitching [10,11]. In the case of the EEG power spectra values, ratios describing the drug effects or actual values over 5 min or 2-h periods have been submitted to multivariate analysis of variance (MANOVA) for repeated measures [17]. Motor activity and sleep were evaluated by two-way (time, treatment) ANOVA. Tukey honest significant difference test was used for post-hoc comparisons. Log-transformed values were used for statistical analysis. Ritanserin (0.3 mg/kg i.p.), injected at the beginning of the passive phase, namely light onset, caused a subsequent increase in the EEG power density compared to control treatment in the low frequency range (0.25–6 Hz) (Figs. 1 and 2A). The most prominent increase was observed at 2 Hz (160% compared to vehicle treatment; Fig. 2A). Parallel to this increase in low frequency activity we found a significant decrease in the high frequency range (27–30 Hz; Fig. 2A). At the same time, namely in the first 2 h of injection, a significant increase in total sleep time (TST) and SWS-2 and decrease in SWS-1 and IS were found (Fig. 3A). At the second part of the light phase (9th110th hour),all these effects of ritanserin disappeared (Figs. 1, 2B, 3B). Twelve hours later, at the beginning of the dark period, there was a significant increase in the intermediate band (7–19 Hz) of EEG power spectra (peak: 12–15 Hz) together with a mild increase in the low frequency range in the animals treated with ritanserin (Figs. 1 and 2C). Due to the differences in the power spectra between the two phases a highly significant time3frequency interaction was found (F 51.598; P,0.0001). At the same (551,2850) time, TST and SWS-1 was significantly increased by ritanserin (Fig. 3C), but other parameters of sleep were unaltered.
Motor activity showed significant circadian changes in control and also in ritanserin-treated rats (Fig. 4C). Ritanserin slightly decreased motor activity in the light phase, but a more profound, significant decrease was caused by the drug only at the beginning of the dark phase (Fig. 3C). Ritanserin, in the first 2 h of injection, caused a significant increase in delta activity compared to control treatment (Fig. 4A). SFA remained unchanged in this time period (Fig. 4B). This initial difference in delta activity disappeared after about 6–8 h (Figs. 1 and 4A). At the second part of the light phase, delta activity decreased markedly in both groups (Fig. 4A). Twelve hours after ritanserin treatment, after dark onset, SFA was markedly decreased in the control group, but only slightly, not significantly in the ritanserin group (Fig. 4B). Ritanserin is an antagonist that binds selectively to 5-HT2 receptors [15] although it cannot differentiate among subtypes, namely, 5-HT2A, 5-HT2B and 5-HT2C receptors of the 5-HT2 receptor family [1]. At the dose of 0.3 mg/kg it occupies about 85% of the rat frontal cortex 5-HT2A receptors, and the half-life of the receptor occupation is more than 24 h [15].
Our results show that ritanserin compared to control treatment acutely increases low frequency (peak at 2 Hz) and decreases high frequency EEG activity in the passive (light) phase. Similar results were found previously with 5-HT2 antagonists [2,7]. However, late effects of ritanserin on EEG power spectra, including more than one cycle (12 h), have not been studied. Spectral analysis of EEG during a 20-h period revealed clear differences in the effect of ritanserin regarding the light–dark cycle. At the beginning of the passive phase (light period), ritanserin caused an increase in the low frequency accompanied by a decrease in the high frequency activity of the EEG. Delta activity was almost two times higher after ritanserin treatment compared to control. This effect was over about 6–8 h after the administration of the drug. At the beginning of the active phase, significantly increased EEG power density was found in the range of 7–19 Hz, with peak at 12–15 Hz, which corresponds to the firing frequency of thalamocortical neurons engaged in the generation of spindle activity [18,19,21]. SFA did not changed significantly in the ritanserin-treated group over time, suggesting a maintained thalamo-cortical synchronization in these rats. To help the interpretation of the EEG effects, sleep and vigilance was also analyzed over time. Ritanserin caused an acute increase in SWS-2 at the expense of SWS-1 and wakefulness (W). Similar results were observed previously by other groups in humans [4,5,12,13] and rats [2,6,8,9,14]. All sleep effects of ritanserin disappeared 8 h after the treatment. Interestingly, ritanserin caused additional significant effects at the beginning of the dark phase. At this time SWS-1 increased at the expense of W. No significant effects on other sleep stages were observed at this time. Increase in the EEG power spectra may be taken as synchronization while decrease as desynchronization of the EEG [17]. The increase in SWS-1 and intermediate band of the EEG power spectra (mainly SFA) by ritanserin point to the relative increase in EEG synchronization by the drug at dark onset. This was caused by the fact that at the beginning of the dark phase thalamo-cortical synchronization decreased due to awakening in the control group, but awakening and desynchronization was inhibited by ritanserin. Similar to our data, ritanserin increased thalamus-originated high voltage spindle activity, EEG characteristic in rats during quiet, motionless wakefulness, in an earlier study [6]. The generation of spindles has been shown to be under inhibitory control of the serotonergic and basal forebrain cholinergic system [3]. In a recent review [16], Portas et al. described that the level of serotonin is higher during wakefulness than during sleep in most cortical and subcortical areas receiving serotonergic projections. This suggests that serotonin has a facilitatory role in promoting arousal [16]. This was also the case in our studies. Animals with control t
In addition to increased EEG synchronization, an increase in duration of SWS-1 with decreased vigilance level and motor activity were found in ritanserin-treated rats at the beginning of the active phase. This was unlikely to be the result of a rebound phenomenon, because vigilance and motility decreased also at the beginning of the passive phase. These data are also consistent with the hypothesis that arousal decreased after ritanserin treatment. In conclusion, our studies show that the 5-HT2 receptor antagonist ritanserin has long-term effects on EEG power spectra, sleep and motility, although the appearance of these effects change at phase shift. Early effects at the passive phase include an increase in delta activity accompanied by an increase in duration of SWS-2, while late effects include a relative increase in EEG power density in the intermediate band (mainly SFA) accompanied by an increase in duration of SWS-1 suggesting a maintained thalamo-cortical synchronization over time. AcknowledgementsWe thank Edit A. Modos, Nora R. Nagy and Zsuzsanna E. Anheuer for their help and technical assistance. These studies were supported in part by Ministry of Welfare Research Grant 023/2000, Postdoctoral Ph.D. Fellowship Program (S.K., 1997–2000; R.J., 2000–2003) of the Semmelweis University and Hungarian National Research Fund Grants T020500 and T032398. References[1] D.W. Bonhaus, K.K. Weinhardt, M. Taylor, A. DeSouza, P.M. McNeeley, K. Szczepanski, D.J. Fontana, J. Trinh, C.L. Rocha, M.W. Dawson, L.A. Flippin, R.M. Eglen, RS-102221: a novel high affinity and selective, 5-HT2C receptor antagonist, Neuropharmacology 36 (1997) 621–629. [2] A.A. Borbély, L. Trachsel, I. Tobler, Effect of ritanserin on sleep stages and sleep EEG in the rat, Eur. J. Pharmacol. 156 (1988) 275–278. [3] G. Buzsáki, R.G. Bickford, G. Ponomareff, L.J. Thal, R.J. Mandel, F.H. Gage, Nucleus basalis and thalamic control of neocortical activity in the freely moving rat, J. Neurosci. 8 (1988) 4007–40026. [4] P. Clarenbach, B. Birmanns, C. Jaursch-Hancke, The effect of ritanserin on sleep and hormones in man, in: W.P. Koella, F. Obal, H. Schultz, P. Visser (Eds.), Sleep ’86, Gustav Fischer, Stuttgart, 1988, pp. 355–358. [5] A.C. Declerck, A. Wauquier, P.H.M. Van der Ham-Veltman, Y. Gelders, Increase in slow wave sleep in humans with the serotonin S2 antagonist ritanserin. The first exploratory polygraphic sleep study, Curr. Ther. Res. 41 (1987) 427–432. [6] L. Détári, V. Szentgyörgyi, T. Hajnik, G. Szénási, I. Gacsályi, T. Kukorelli, Differential EEG effects of the anxiolytic drugs, deramciclane (EGIS-3886), ritanserin and chlordiazepoxide in rats, Psychopharmacology 142 (1999) 318–326. [7] D.J. Dijk, D.G.M. Beersma, S. Daan, R.H. van den Hoofdakker, Effects of seganserin, a 5-HT2 antagonist, and temazepam on human sleep stages and EEG power spectra, Eur. J. Pharmacol. 171 (1989) 207–218. [8] C. Dugovic, A. Wauquier, 5-HT2 receptors could be primarily involved in the regulation of slow-wave sleep in the rat, Eur. J. Pharmacol. 137 (1987) 145–146. [9] C. Dugovic, J.E. Leysen, P.F. Janssen, A.Wauquier, The light–dark cycle modulates the effect of ritanserin on sleep–wakefulness patterns in the rat, Pharmacol. Biochem. Behav. 34 (1989) 533– 5337. [10] J. Filakovszky, S. Kantor, P. Halasz, G. Bagdy, 8-OH-DPAT and MK-801 affect epileptic activity independently of vigilance, Neurochem. Int. 38 (2001) 551–556. [11] C. Gottesmann, Detection of seven sleep–waking stages in the rat, Neurosci. Biobehav. Rev. 16 (1992) 31–38. [12] C. Idzikowsky, P.J. Cowen, D. Nutt, F.J. Mills, The effects of chronic ritanserin treatment on sleep and the neuroendocrine response to L-tryptophan, Psychopharmacology 93 (1987) 416–420. [13] C. Idzikowsky, F.J. Mills, R. Glennard, 5-Hydroxy-tryptamine-2 antagonist increases human slow wave sleep, Brain Res. 378 (1986) 164–168. [14] S. Kantor, K. Gerber, P. Halasz, G. Bagdy, The role of 5-HT2A 5-HT2C and 5-HTC serotonin receptors in the regulation of sleep, J. Physiol. 526 (2000) 66–67. [15] J.E. Leysen, W. Gommeren, P. Van Gompel, J. Wynants, P.F.M. Janssen, P.M. Laudron, Receptor-binding properties in vitro and in vivo of ritanserin, a very potent and long acting serotonin-S2 antagonist, Mol. Pharmacol. 27 (1985) 600–611. [16] C.M. Portas, B. Bjorvatn, R. Ursin, Serotonin and the sleep/wake cycle: special emphasis on microdialysis studies, Prog. Neurobiol. 60 (2000) 13–35. [17] C. Sebban, X.Q. Zhang, B. Tesolin-Decros, M.J. Millan, M. Spedding, Changes in EEG spectral power in the prefrontal cortex of conscious rats elicited by drugs interacting with dopaminergic and noradrenergic transmission, Br. J. Pharmacol. 128 (1999) 1045–1054. [18] M. Steriade, R.R. Llinás, The functional states of the thalamus and the associated neuronal interplay, Physiol. Rev. 68 (1988) 649–742. [19] M. Steriade, R.W. McCarley (Eds.), Brainstem Control of Wakefulness and Sleep, Plenum Press, New York, 1990. [20] K. Swensson, P. Alföldi, M. Hajós, G. Rubicsek, A.M. Johansson, A. Carlsson, F. Obál Jr., Dopamine autoreceptor antagonists: effects on sleep–wake activity in the rat, Pharmacol. Biochem. Behav. 26 (1987) 123–129. [21] G. Terrier, C.L. Gottesmann, Study of cortical spindles during sleep in the rat, Brain Res. Bull. 3 (1978) 701–706. |