Neuroscience Letters 658 (2017) 37-42
DOI: 10.1016/j.neulet.2017.08.020
Péter Przemyslaw Ujmaa,b, Péter Halászb, Anna Kelemenb, Dániel Fabób, Loránd Erőssb
a Semmelweis University, Institute of Behavioural Sciences, Nagyvárad tér 4, Budapest, H-1089, Hungary
b National Institute of Clinical Neuroscience, Amerikai út 57., Budapest, H-1145, Hungary
Abstract
Epileptiform activity in various but not all epilepsy and recording types and cerebral areas is more frequent in NREM sleep, and especially during sleep periods with high-amplitude EEG slow waves. Slow waves synchronize high-frequency oscillations: physiological activity from the theta through the gamma band usually appears during scalp-positive upstates while epileptiform activity occurs at transitory phases and the scalp-negative downstate. It has been proposed that interictal discharges (IIDs) are facilitated by the high degree of neuronal firing synchrony during slow wave transitory and downstates. This would suggest that their occurrence increases as a function of slow wave synchronization, indicated by greater amplitude, steeper slopes and higher EEG signal synchronization. We investigated the occurrence of IIDs during NREM sleep slow waves in epileptic patients undergoing presurgical electrophysiological monitoring. Intracranially registered IIDs preferentially occurred during the scalp-negative downstates of frontal scalp slow waves in all subjects. IID occurrence was more frequent during larger slow waves in the pooled sample and a subset of subjects. However, slow wave slope steepness and EEG signal synchronization between two frontal scalp channels was not significantly associated with IID occurrence. Our results indicate that IIDs indeed do not occur at the same slow wave phase as physiological rhythms, but contrary to previous hypotheses their occurrence is not strongly affected by EEG synchronization.
Keywords: Epilepsy, Interictal discharge, Slow wave, NREM sleep, EEG
1. Introduction
Epileptiform activity occurs more frequently during NREM sleep [9,15,28]. This effect is even more pronounced when low-frequency, high-amplitude slow waves (SWs) are present [3,11,12,25,33,34]. On the other hand, negative associations between epileptiform activity and delta power in epilepsies due to focal dysplasia [37] and lower deep sleep interictal spike rates in the medial lobe (but not on the scalp) [4] have been also reported, while in idiopathic childhood focal/regional hyper-excitability syndromes (Rolandic epilepsy and Panayiotopoulos syndrome) [2,14,23], Landau-Kleffner syndrome [21] and in one study cortical dysplasia [37] sleep spindle-related sigma power has been reported to be more strongly associated with epileptiform activity than slow wave activity.
The reason why epileptiform phenomena occur at a differentrate as a function of low-frequency electrophysiological events may be understood through how neuronal firing is modulated during these low-frequency oscillations.
Low-frequency oscillations in sleep characteristically synchronize neural firing and, consequently, higher frequency oscillations. These include both infraslow oscillations (0.02 < 2 Hz) [36] and the traditional slow oscillation (≈1 Hz) [6,31], reflected by scalp and ECoG slow waves [20]. Physiological fast rhythms – most prominently sleep spindles and hippocampal ripples [5,19,30], but also gamma rhythms [35] – are temporally synchronized to occur during the surface-positive upstates of these slower oscillations.
Recent evidence suggests, however, that this is not the case for some of the electrophysiological markers of epilepsy. Interictal discharges (IIDs, “spikes”) preferentially occur away from peak upstate of the infraslow oscillation [36] and – together with epileptiform high-frequency oscillations – during the downstate of slow waves [10].
It has been suggested [10] that epileptiform phenomena are more common in NREM sleep because of the presence of SWs, more specifically SW downstates, which elicit IIDs and high-frequencyoscillations through the engagement of inhibitory mechanisms which synchronize neural activity [1,8,16]. Two lines of evidence were provided for this hypothesis: 1) IIDs preferentially occur during the early SW downstate where neuronal firing is normally silenced, but synchronization is high 2) IIDs occur more frequently during larger SWs where synchronization is assumed to be greater. These effects were convincingly demonstrated in a very carefully selected sample of patients with frontally implanted corticographic electrodes, NREM sleep from the first sleep cycle, and a selective sample of high-amplitude SWs and visually detected IIDs. The findings are crucially important in order to understand the epileptogenic mechanisms of sleep, but some of the authors’ hypotheses– including the extent to which these results can be generalized –remain untested. Our aim was to 1) replicate these findings [10] in a sample ofepileptic patients with various pathologies, without regard for circadian effects, cerebral ECoG locations and with a less selectiveautomatic IID detection algorithm 2) test the paper’s hypothesis concerning the relationship between neuronal synchrony andinterictal IID occurrence with novel methods more specifically capturing the synchronization effects reflected by the EEG signal.
2. Materials and methods
2.1. Patients
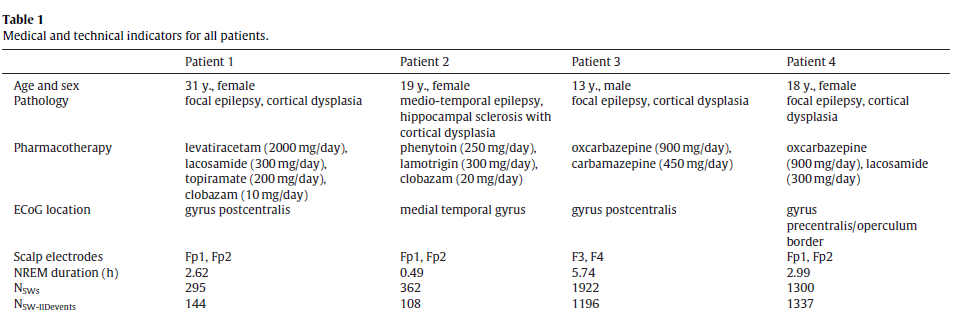
We selected night sleep EEG data from four epileptic patients undergoing presurgical electrophysiological monitoring. The mainselection criteria were the absence of seizures, the high qualityof both scalp EEG and ECoG signals and the presence of clearly identifiable NREM sleep with well-visible slow waves. We only considered patients whose characteristic IIDs were single-peak instead of burst-like in order to be able to clearly identify the precise timingof IIDs. We deliberately included patients with various pathologies and did not strictly control for implantation location and circadian processes in order to provide generalizable findings. All interventions were approved by the hospital ethical boards and all patients gave informed consent according to the Declarationof Helsinki. Patient data is summarized in Table 1.
Table 1.
2.2. EEG recording and processing
ECoG was recorded via subdural strip and grid electrodes implanted over the presumed epileptogenic area. The implantation procedure and the location of the electrodes was part of the presurgical evaluation of the patients, and it was not biased by scientific purposes. Ad-tech (Racine, WI, USA) strip and grid electrodes were used. Scalp EEG from frontal channels was co-recorded with ECoGin all patients (see Table 1 for the scalp EEG electrodes used for analysis).
Both ECoG and scalp EEG was co-recorded using Brain-quick System Plus (Micromed SpA, Mogliano-Veneto, Italy) LTM systemwith a contralateral mastoid reference. The sampling rate was 1024 Hz, hardware filters were set between 0.3 and 300 Hz. Recordings were amplified and digitized with 22-bit resolution. ECoG/EEG was visually scored on a 20s basis based on standard criteria [13] focusing only on distinguishing N2/SWS from other states, followed by a visual rejection of artifacts (including IIDs visible on the scalp) on a 4s basis. Only artifact-free segments of N2 and SWS wereconsidered for further analysis.
2.3. SW and IID detection
Both SWs and IIDs were detected automatically with customalgorithms implemented in MATLAB.
SWs were detected based on previously described methodology [26]. The signals from the two scalp EEG signals were averaged and band-pass filtered (0.5–4 Hz, two-way least-squares FIR filtering). A SW was detected if in the averaged, filtered signal a negative zero-crossing was followed by a minimum negative value of at least 60 µV, followed by a positive zero-crossing within 0.2–1 s, and the peak-to-peak voltage difference of the minimum negative value and the subsequent maximum positive value was at least 75 µV. If these criteria were met, then a SW was defined as lasting fromthe initial negative zero crossing until the negative zero crossing following the maximum positive value.
IIDs were detected semi-automatically. ECoG channels were high-pass filtered (30 Hz, two-way least-squares FIR filtering) and IIDs were detected if the filtered signal exceeded a pre-determined amplitude threshold. The amplitude threshold was defined individually for each patient by visual inspection of both the filtered and unfiltered ECoG data. The automatic detections using these pre-determined amplitude criteria were confirmed by visual inspectionby experienced raters. During ECoG data inspection, the rater was blind to scalp EEG data. IIDs were only considered as separate if they were separated by at least 0.25 s. The exact time point of IID occurrence was defined at the largest absolute voltage during the IID (IID peak).
IIDs were detected for all ECoG channels, followed by the selection of the channels with the most IIDs based on automatic IID counting and visual inspection (1 channel for Patient 1 and 3, 3 channels for Patient 2 and 4). IIDs detected from these channels were considered for further analysis. Multiple channels were onlyconsidered if no single channel was representative of all IIDs. In case of multiple selected channels, IIDs from any of these channels were considered as long as they did not overlap according to the generally applied 0.25 s criterion. In case of overlap (concomitant IIDs on multiple channels with variable IID timing), the timing of the IID with the largest voltage was considered.
An SW and an IID were considered co-occurring if the IID peak occurred at a data point which was also marked as part of an automatically detected SW. The SW phase at the co-occurrence was determined by the phase angle of the Hilbert transform of the averaged, filtered signal of the two scalp electrodes at the data point at which the IID peak occurred.
2.4. Statistical analysis
We performed statistical analyses to perform two main goals:
- Determine whether or not IIDs are symmetrically distributed along SW phases if the two events co-occur, or they preferentially occur during a specific SW phase.
The symmetry of IID occurrences during SW phases was investigated using Rayleigh’s test of circular uniformity both in individual patients and in the pooled sample.
- Determine the SW parameters which contribute to increased IID occurrence as suggested by Frauscher et al. [10]. Among possible parameters we investigated three:
− SW amplitude, as an indirect indicator of the maximal degreeof synchronized neural firing during SW generation
− the steepness of the descending downstate (the SW slopebetween the negative zero crossing and the maximal negative amplitude), as a proxy measure of the rapidity of neural firing synchronization [7,27]
− Synchronization Likelihood (SL) [29] between the two scalp EEG channels as a mathematical indicator of signal synchronization and an indirect measure of functional synchrony between the neural generators of EEG. SL is sensitive to both linear and non-linear effects, making it particularly well-suited for measuring EEG synchronization [32].
The three SW synchronization measures were correlated, but not to the degree of redundancy. SW amplitude exhibited a relatively high correlation with slope in all four patients (r = −0.434–0.633, p < 0.001 in all cases), and a modest correlation with SL (r = −0.145–0.224, p < 0.001 in all cases). SL correlated with slope in patients 3 and 4 (r = 0.136, p < 0.001 and r = 0.076, p = 0.001, respectively) but not in patients 1 and 2 (r = −0.041, p = 0.483 and r = 0.071, p = 0.178, respectively). (Note that amplitude values are negative, resulting in negative correlations if higher amplitude is associated with higher SL or steeper slope. All reported associations are based on Pearson’s point-moment correlations.)
We split up SWs into four quartiles along the values of all three SW parameters (amplitude, slope, SL) and generated a binary variable indicating if at least one IID occurred during an SW (value: 1) or not (value: 0). SW parameter quartiles were determined by subject. We tested the homogeneity of IID occurrence chance across SW parameter quartiles using χ2 tests in the pooled sample. Due to the fact that we tested three different associations, the critical p-value was set at α = 0.05/3 = 0.016. The same analysis was repeated within individual patients. In this case the uncorrected p-values are reported in order to illustrate the robustness of the findings acrosspatients.
3. Results
3.1. Scalp EEG and ECoG
Slow waves were recorded on frontal scalp channels but IIDs were detected in more caudally implanted ECoG electrodes. While slow waves are generally synchronous across broad cortical and even subcortical areas [20], there is noticeable temporal delay between peaks across distant cortical areas in the range of tens of milliseconds up to over one hundred millisecond [17,18]. In order to investigate the typical phase difference between slow waves on the frontal scalp channels and over the investigated cortical are averaged 2 s band-pass filtered ECoG data segments (0.5–4 Hz) around scalp downstate peaks from the same channel on which IIDs were recorded. In case of multiple selected ECoG IID channels a single channel was selected for this analysis at random. We used ECoG electrodes with spiking activity because nearby non-spiking channels were not available for all subjects and because most co-occurring IIDs did not visibly alter SW morphology after the 0.5–4 Hz filtering was applied. This observation was confirmed by the fact that the phase and morphology of scalp slow waves was generally preserved on the selected ECoG channel, despite the potential distorting effect of the IIDs. Fig. 1 illustrates the meanECoG data triggered to scalp downstate peaks.
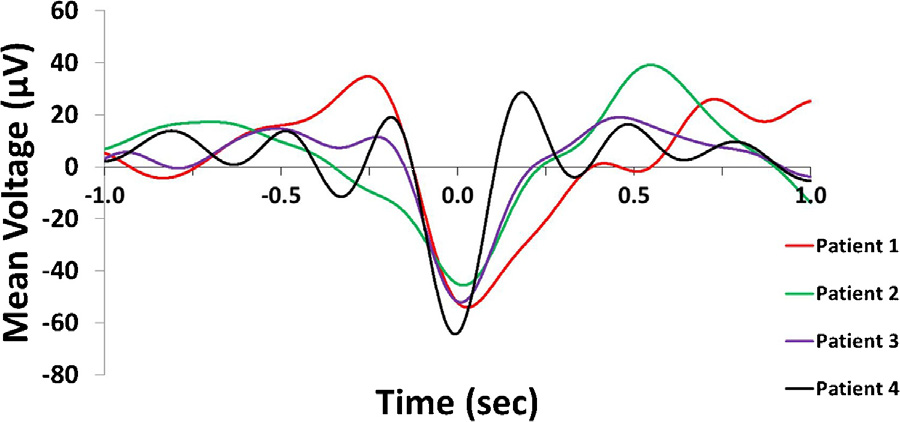
Fig. 1. Averaged ECoG signal triggered to the peak of the downstate (indicated as0 s).
3.2. IID occurrence during SW phases
The occurrence of IIDs during SW phases was non-uniform in allsubjects (Patient 1: Rayleigh’s z = 9.2507, p = 8.5196*10−5; Patient2: z = 3.2954, p = 0.0367; Patient 3: z = 15.19, p = 2.4177*10−7;Patient 4: z = 27.9411, p = 6.3955*10−13) as well as in the pooledsample (z = 42.37, p = 3.33725*10−19). IIDs occurred more fre-quently during the downstate. Fig. 2 illustrates the non-uniformityof IID occurrences as a function of SW phases.
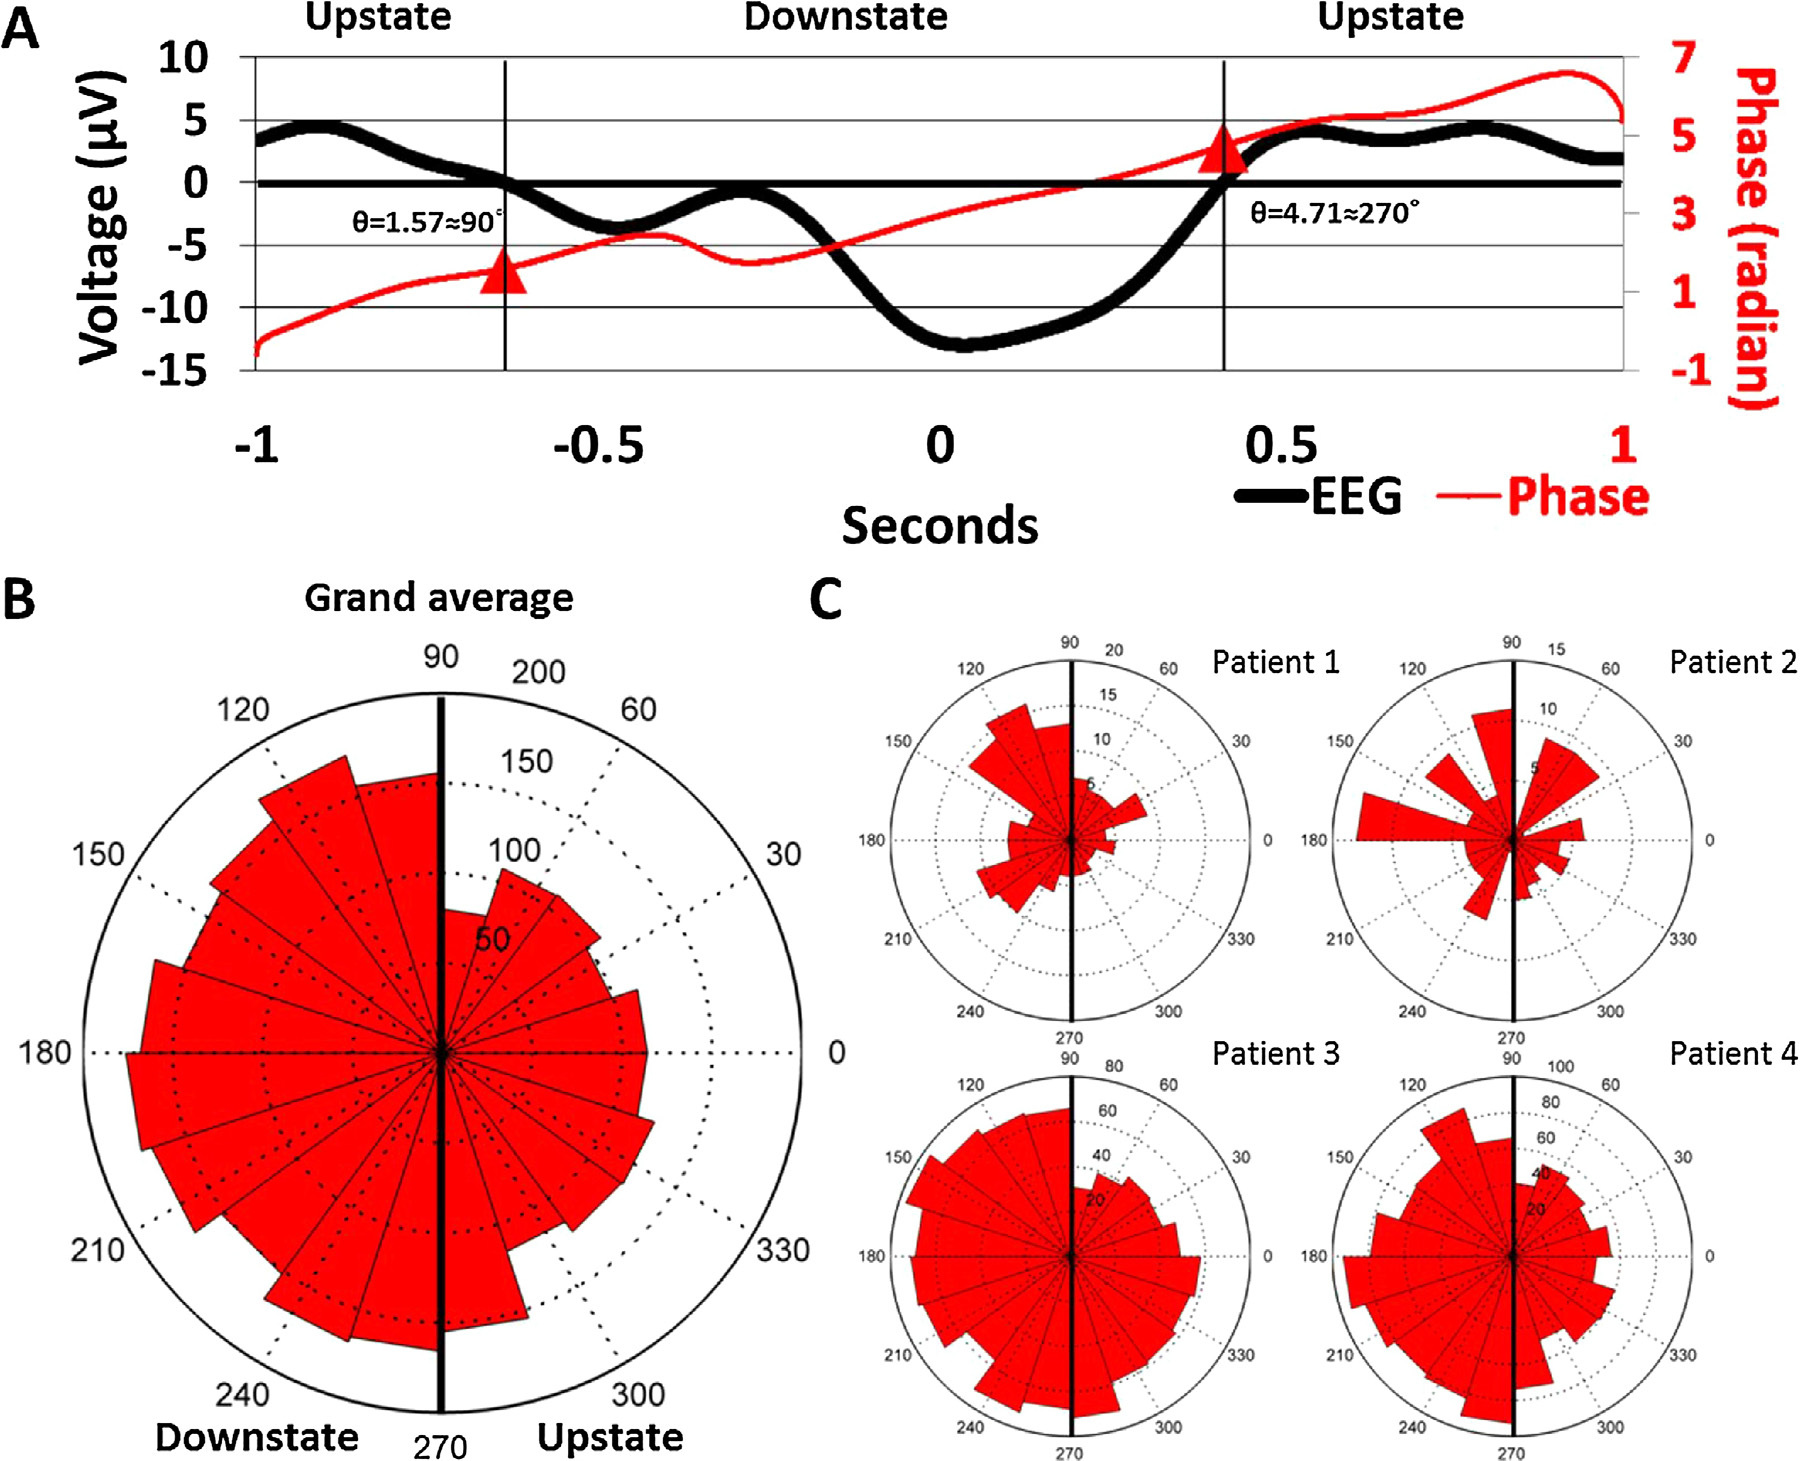
Fig. 2. Panel A: Representative IID-triggered average EEG signal from Patient 3. The black line represents the scalp EEG signal averaged across all ECoG IID detections (including those not co-occurring with scalp SWs) and both scalp EEG electrodes, triggered to the maximum amplitude of ECoG IIDs (indicated as 0 s). Note the similarity to a low-voltage SW. The red line shows the unwrapped phases (defined as the phase angle of the Hilbert transform) of the same averaged signal in order to illustrate how signal phases correspond to SW morphology. Data points corresponding to the 90◦and 270◦angles (negative and positive zero crossings defining the beginning and the end of the downstate) are marked with a red triangle. Note that while all data where the voltage is positive is marked as “upstate”, SWs were defined as starting with the negative zero-crossing. Therefore, the positive values preceding the negative zero-crossing were only classified as a SW upstate if they were part of another SW immediately preceding the one starting the one at the negative zero-crossing. Panel B: rose histogram of all concurrent SW-IID events as a function of SW phase at the maximum amplitude of the concurrent IID. Values between 90◦and 270◦correspond to the downstate, while values between lower than 90◦or higher than 270◦correspond to the upstate. Concentric dashed circles indicate the number of cases in a phase bin, as indicated between the 12 h and 1 h position. Panel C: identical rose histogram demonstrating the robustness of increased IID occurrence during SWs across patients. (For interpretation of the references to colour in this figure legend, the reader is referred to the web version of this article.)
3.3. Synchronization measures and IID occurrence
IIDs occurred more frequently during larger SWs, as previously reported [10] (χ2 = 15.85, p = 0.001 in the pooled sample, significant after correction for multiple comparisons). This effect was significant in both Patient 2 and 3 (χ2= 9.39, p = 0.024 and χ2= 11.01, p = 0.012, respectively) remained a tendency in Patient4 (χ2= 2.99, p = 0.393) and did not appear in Patient 1 at all (χ2= 0.996, p = 0.802). The associations between Synchronization Likelihood, down-state slope and IID occurrence probability was not significant after correcting for multiple comparisons. IIDs exhibited a tendency to occur more frequently during SWs with lower Synchronization Likelihood (χ2= 8.76, p = 0.032 in the pooled sample, not significant after correction for multiple comparisons). This effect was marginally significant only in Patient 3 (χ2= 7.97, p = 0.047) but not in any of the other subjects (χ2= 0.6–2.54, pmin= 0.496). Similarly, IIDs exhibited a tendency to occur more frequently during SWs with less steep descending downstates (χ2= 8.91, p = 0.03 in the pooled sample, not significant after correction for multiple comparisons). This effect was also not significant for any of the four subjects individually (χ2= 1.945–6.988, pmin= 0.072). Fig. 3 illustrates the occurrence of IIDs during SWs belongingto each of the four slope quartiles. The patientwise breakdown ofthese relationships is shown in Supplementary Fig. S1.

Fig. 3. Pooled averages of the proportions of SWs with at least one co-occurring IID as a function of SW synchronization measures. Higher quartile numbers indicate SWs with larger amplitude, greater Synchronization Likelihood and steeper descending downstate slope, respectively.
4. Discussion
Our results confirm that previous findings [10] about the relationship between SWs and IIDs can be generalized to more diverse pathologies, implantation locations and less selective IID populations, and that they are not exclusive to the early night. IIDs indeed do not preferentially occur during the upstate, but rather the downstate. While SW phase was measured on the scalp due to the difficulty of determining it in ECoG recordings [35], ECoG phase at the location of IID occurrence seems to be similar (Fig. 1), in line with previous findings [20]. Some delay due to the physical distance between scalp and ECoG locations and the travelling nature of SWs is present between peak voltages [17], but it is not sufficient to significantly affect the interpretation of SW phases at the implantation locations.
Our results also generally confirm that high amplitude SWs have a greater chance of co-occurring with an IID. However, this effect was not present in all subjects and we found a much smaller effect with a IID occurrence odds ratio of 1.16 (highest quartile versus lowest quartile) as opposed to the roughly two fold increase (highest amplitude versus lowest amplitude) in IID presence likelihood previously reported [10].
We failed to confirm the hypothesis that greater neural synchrony, reflected by SW parameters, is linearly related to the probability of IID occurrence. Both a mathematical (Synchronization Likelihood) and a physiological (SW slope) measure of synchronization failed to account for this effect, as neither was related to the probability of IID occurrence after correcting for multiple comparisons.
An important limitation of our study is the prevalence of corticaldysplasia as the cause of epilepsy in our patients. Cortical dysplasiais characterized by very frequent IIDs [24] and a particularly strong sleep dependence of its electrophysiological markers [22]. Thus, the effects reported here may not be representative for all epilepsy types.
5. Conclusion
In conclusion, we found supporting evidence that IIDs occur during the downstate of slow waves, and more frequently dur-ing larger slow waves. However, we failed to find a relationship between more direct measures of the degree of synchrony in neural firing (or its derivative, the EEG signal) and IID occurrence probability, suggesting that either synchronized neural activity is not the mechanism by which NREM sleep facilitates epileptiform activity, or that this effect of synchrony does not increase beyond a certain threshold which is exceeded even during less synchronized SWs.
Acknowledgements
This research was supported by the following grants: OTKA PD101754, KTIA NAP 13-1-2013-0001. Péter P. Ujma was supported by the ÚNKP-16-4 New National Excellence Program of the Ministry of Human Capacities.
Appendix A. Supplementary data
Supplementary data associated with this article can be found in the online version
http://dx.doi.org/10.1016/j.neulet.2017.08.020.
References
[1] M. Avoli, M. de Curtis, GABAergic synchronization in the limbic system and its role in the generation of epileptiform activity, Prog. Neurobiol. 95 (2011) 104–132.
[2] M. Beelke, L. Nobili, M.G. Baglietto, F. De Carli, A. Robert, E. De Negri, F. Ferrillo, Relationship of sigma activity to sleep interictal epileptic discharges: a study in children affected by benign epilepsy with occipital paroxysms, Epilepsy Res. 40 (2000) 179–186.
[3] A. Bonakis, M. Koutroumanidis, Epileptic discharges and phasic sleep phenomena in patients with juvenile myoclonic epilepsy, Epilepsia 50 (2009) 2434–2445.
[4] Z. Clemens, J. Janszky, A. Szucs, M. Bekesy, B. Clemens, P. Halasz, Interictal epileptic spiking during sleep and wakefulness in mesial temporal lobe epilepsy: a comparative study of scalp and foramen ovale electrodes, Epilepsia 44 (2003) 186–192.
[5] Z. Clemens, M. Molle, L. Eross, P. Barsi, P. Halasz, J. Born, Temporal coupling of parahippocampal ripples, sleep spindles and slow oscillations in humans, Brain 130 (2007) 2868–2878.
[6] A. Destexhe, D. Contreras, M. Steriade, Spatiotemporal analysis of local field potentials and unit discharges in cat cerebral cortex during natural wake andsleep states, J. Neurosci. 19 (1999) 4595–4608.
[7] S.K. Esser, S.L. Hill, G. Tononi, Sleep homeostasis and cortical synchronization: I. Modeling the effects of synaptic strength on sleep slow waves, Sleep 30 (2007) 1617–1630.
[8] M. Farrant, K. Kaila, The cellular, molecular and ionic basis of GABA(A) receptor signalling, Prog. Brain Res. 160 (2007) 59–87.
[9] N. Foldvary-Schaefer, M. Grigg-Damberger, Sleep and epilepsy: what we know, don’t know, and need to know, J. Clin. Neurophysiol. 23 (2006) 4–20.
[10] B. Frauscher, N. von Ellenrieder, T. Ferrari-Marinho, M. Avoli, F. Dubeau, J. Gotman, Facilitation of epileptic activity during sleep is mediated by high amplitude slow waves, Brain 138 (2015) 1629–1641.
[11] G.L. Gigli, E. Calia, M.G. Marciani, S. Mazza, G. Mennuni, M. Diomedi, M.G.Terzano, D. Janz, Sleep microstructure and EEG epileptiform activity inpatients with juvenile myoclonic epilepsy, Epilepsia 33 (1992) 799–804.
[12] P. Halasz, M.G. Terzano, L. Parrino, Spike-wave discharge and the microstructure of sleep-wake continuum in idiopathic generalised epilepsy, Neurophysiol. Clin. 32 (2002) 38–53.
[13] C. Iber, S. Ancoli-Israel, A. Chesson, S. Quan, The AASM Manual for the Scoring of Sleep and Associated Events: Rules, Terminology and Technical Specification, American Academy of Sleep Medicine, Westchester IL, 2007.
[14] P. Kellaway, The electroencephalographic features of benign centrotemporal (rolandic) epilepsy of childhood, Epilepsia 41 (2000) 1053–1056.
[15] B.A. Malow, X. Lin, R. Kushwaha, M.S. Aldrich, Interictal spiking increases with sleep depth in temporal lobe epilepsy, Epilepsia 39 (1998) 1309–1316.
[16] E.O. Mann, O. Paulsen, Role of GABAergic inhibition in hippocampal network oscillations, Trends Neurosci. 30 (2007) 343–349.
[17] M. Massimini, R. Huber, F. Ferrarelli, S. Hill, G. Tononi, The sleep slow oscillation as a traveling wave, J. Neurosci. 24 (2004) 6862–6870.
[18] D. Menicucci, A. Piarulli, U. Debarnot, P. d’Ascanio, A. Landi, A. Gemignani, Functional structure of spontaneous sleep slow oscillation activity in humans, PLoS One 4 (2009) e7601.
[19] M. Mölle, L. Marshall, S. Gais, J. Born, Grouping of spindle activity during slow oscillations in human non-Rapid eye movement sleep, J. Neurosci. 22 (2002) 10941.
[20] Y. Nir, R.J. Staba, T. Andrillon, V.V. Vyazovskiy, C. Cirelli, I. Fried, G. Tononi, Regional slow waves and spindles in human sleep, Neuron 70 (2011) 153–169.
[21] L. Nobili, M.G. Baglietto, M. Beelke, F. De Carli, E. De Negri, S. Tortorelli, F.Ferrillo, Spindles-inducing mechanism modulates sleep activation of interictal epileptiform discharges in the Landau-Kleffner syndrome, Epilepsia 41 (2000) 201–206.
[22] L. Nobili, F. Cardinale, U. Magliola, A. Cicolin, G. Didato, M. Bramerio, D.Fuschillo, R. Spreafico, R. Mai, I. Sartori, S. Francione, G. Lo Russo, L. Castana, L.Tassi, M. Cossu, Taylor’s focal cortical dysplasia increases the risk of sleep-related epilepsy, Epilepsia 50 (2009) 2599–2604.
[23] L. Nobili, F. Ferrillo, M.G. Baglietto, M. Beelke, F. De Carli, E. De Negri, G.Schiavi, G. Rosadini, M. De Negri, Relationship of sleep interictal epileptiform discharges to sigma activity (12–16 Hz) in benign epilepsy of childhood with rolandic spikes, Clin. Neurophysiol. 110 (1999) 39–46.
[24] A. Palmini, A. Gambardella, F. Andermann, F. Dubeau, J.C. da Costa, A. Olivier,D. Tampieri, P. Gloor, F. Quesney, E. Andermann, et al., Intrinsic epileptogenicity of human dysplastic cortex as suggested by corticography and surgical results, Ann. Neurol. 37 (1995) 476–487.
[25] L. Parrino, F. De Paolis, G. Milioli, G. Gioi, A. Grassi, S. Riccardi, E. Colizzi, M.G.Terzano, Distinctive polysomnographic traits in nocturnal frontal lobe epilepsy, Epilepsia 53 (2012) 1178–1184.
[26] G. Piantoni, S.S. Poil, K. Linkenkaer-Hansen, I.M. Verweij, J.R. Ramautar, E.J.Van Someren, Y.D. Van Der Werf, Individual differences in white matter diffusion affect sleep oscillations, J. Neurosci. 33 (2013) 227–233.
[27] B.A. Riedner, V.V. Vyazovskiy, R. Huber, M. Massimini, S. Esser, M. Murphy, G.Tononi, Sleep homeostasis and cortical synchronization: III. A high-density EEG study of sleep slow waves in humans, Sleep 30 (2007) 1643–1657.
[28] R.J. Staba, C.L. Wilson, A. Bragin, D. Jhung, I. Fried, J. Engel Jr., High-frequency oscillations recorded in human medial temporal lobe during sleep, Ann.Neurol. 56 (2004) 108–115.
[29] C.J. Stam, B.W. van Dijk, Synchronization likelihood: an unbiased measure of generalized synchronization in multivariate data sets, Physica D 163 (2002) 236–251.
[30] B.P. Staresina, T.O. Bergmann, M. Bonnefond, R. van der Meij, O. Jensen, L.Deuker, C.E. Elger, N. Axmacher, J. Fell, Hierarchical nesting of slow oscillations, spindles and ripples in the human hippocampus during sleep, Nat. Neurosci. Adv. Online Publ. (2015).
[31] M. Steriade, A. Nunez, F. Amzica, A novel slow (<1 Hz) oscillation of neocortical neurons in vivo: depolarizing and hyperpolarizing components, J. Neurosci. 13 (1993) 3252–3265.
[32] J.R. Terry, C. Anderson, J.A. Horne, Nonlinear analysis of EEG during NREM sleep reveals changes in functional connectivity due to natural aging, Hum. Brain Mapp. 23 (2004) 73–84.
[33] M.G. Terzano, L. Parrino, S. Anelli, P. Halasz, A. Portera-Sánchez, Modulation of generalized spike-and-Wave discharges during sleep by cyclic alternating pattern, Epilepsia 30 (1989) 772–781.
[34] P.P. Ujma, P. Simor, R. Ferri, D. Fabó, A. Kelemen, L. Er”oss, R. Bódizs, P. Halász, Increased interictal spike activity associated with transient slow wave trainsduring non-rapid eye movement sleep, Sleep Biol. Rhythms 13 (2015) 155–162.
[35] M. Valderrama, B. Crépon, V. Botella-Soler, J. Martinerie, D. Hasboun, C.Alvarado-Rojas, M. Baulac, C. Adam, V. Navarro, M. Le Van Quyen, Human gamma oscillations during slow wave sleep, PLoS One 7 (2012) e33477.
[36] S. Vanhatalo, J.M. Palva, M.D. Holmes, J.W. Miller, J. Voipio, K. Kaila, Infraslow oscillations modulate excitability and interictal epileptic activity in the human cortex during sleep, Proc. Natl. Acad. Sci. U. S. A. 101 (2004)5053–5057.
[37] F. Zubler, A. Rubino, G. Lo Russo, K. Schindler, L. Nobili, Correlating interictal spikes with sigma and delta dynamics during non-Rapid-Eye-Movement-Sleep, Front. Neurol. 8 (2017) 288.
© 2017 Elsevier B.V. All rights reserved.