SLEEP 41: (3) (2018)
DOI: 10.1093/sleep/zsx210
Péter Simor1,2, Ferenc Gombos3, Borbála Blaskovich4, Róbert Bódizs5,6
1Institute of Psychology, Eötvös Loránd University, Hungary
2Nyírő Gyula Hospital, National Institute of Psychiatry and Addictions, Budapest, Hungary
3Department of General Psychology, Pázmány Péter Catholic University, Budapest, Hungary
4Department of Cognitive Science, Budapest University of Technology and Economics, Budapest, Hungary
5Semmelweis University, Institute of Behavioural Sciences, Budapest, Hungary
6National Institute of Clinical Neuroscience, Budapest, Hungary
Abstract
Rapid eye movement (REM) sleep is characterized by the alternation of two markedly different microstates, phasic and tonic REM. These periods differ in awakening and arousal thresholds, sensory processing, and spontaneous cortical oscillations. Previous studies indicate that although in phasic REM, cortical activity is independent of the external environment, attentional functions and sensory processing are partially maintained during tonic periods. Large-scale synchronization of oscillatory activity, especially in the α- and β-frequency ranges, can accurately distinguish different states of vigilance and cognitive processes of enhanced alertness and attention. Therefore, we examined long-range inter- and intrahemispheric as well as short-range electroencephalographic synchronization during phasic and tonic REM periods quantified by the weighted phase lag index. Based on the nocturnal polysomnographic data of 19 healthy adult participants, we showed that long-range inter- and intrahemispheric α and β synchrony was enhanced in tonic REM states in contrast to phasic ones, and resembled α and β synchronization of resting wakefulness. On the other hand, short-range synchronization within the γ-frequency range was higher in phasic compared with tonic periods. Increased short-range synchrony might reflect local and inwardly driven sensorimotor activity during phasic REM periods, whereas enhanced long-range synchrony might index frontoparietal activity that reinstates environmental alertness after phasic REM periods.
Keywords: weighted phase lag index, frontoparietal, REM sleep, synchronization, EEG
Statement of Significance
Rapid eye movement (REM) sleep is composed of the alternation of two microstates: phasic and tonic REM. Previous studies showed that cortical oscillations as measured by EEG spectral power densities show marked differences between phasic and tonic states. More specifically, α and β power is consistently higher during tonic, whereas γ activity is enhanced during phasic periods. We complemented these findings by analyzing synchronized activity within these frequency bands. We showed that α and β oscillations exhibit higher synchronization during tonic compared with phasic periods, especially between distant regions. On the other hand, phasic REM periods were characterized by relatively increased local (short-range) γ synchronization. Our findings contribute to the understanding of the complex and heterogeneous nature of REM sleep.
Introduction
Rapid eye movement (REM) sleep is a unique neural state that occupies 20%–25% of nighttime sleep in healthy human individuals [1]. REM sleep was termed as a paradoxical state [2], due to its combination of high cortical activity indexed by low voltage, mixed frequency electroencephalographic (EEG) oscillations, and low muscle tone [1]. In fact, intense sensorimotor and oneiric (dream) activity accompanied by inhibited motor output and reduced environmental processing [3–9] are essential features of REM sleep. Nevertheless, the nature of REM sleep seems to be even more complex, as it is composed of two markedly different brain states. The phasic REM state is characterized by transient bursts of ocular movements, myoclonic twitches, and irregular vegetative activity that occur quasiperiodically [10] on the background of an apparently more quiescent, tonic state [11–13]. Phasic REM sleep is accompanied by so-called ponto–geniculo–occipital (PGO) potentials originating spontaneously in the pontine reticular formation and transferred to the thalamocortical system and the hippocampal formation [14].
Phasic and tonic REM periods differ in awakening or arousal thresholds, and sensory processing, as the tonic episode shows generally lower thresholds [5, 15] and functional evoked responses to deviant tones, resembling evoked potentials during wakefulness [16]. In addition, acoustic stimuli presented during the tonic state elicited a residual blood oxygen level dependent response within the auditory cortex, whereas no such reactivity was evidenced during phasic periods [17]. The authors of this study speculate that phasic REM periods represent a functionally isolated brain state, in contrast to tonic periods, in which environmental processing is partially preserved [17]. Moreover, sensory stimulation seems to suppress phasic REM activity and facilitate the transition to the tonic state leading to arousals and microawakenings [18] that make the analyses of phasic REM sleep by functional magnetic resonance imaging (fMRI) quite challenging since sensory stimulation (noise and vibration) is always present in the MR environment [19].
The analysis of spontaneous EEG oscillations is an efficient approach in order to compare phasic and tonic neural activities in an ecologically valid environment. A consistent finding of scalp EEG studies was a relative increase in α- (8–13 Hz) and β- (~14–30 Hz) frequency band power during tonic periods [20–22], which was also evidenced by intracranial sleep recordings [23, 24]. Oscillatory activity in the α- and β-frequency ranges measured during resting-state wakefulness reflects the activation of a widely distributed cingulo–insular–thalamic neural network [25] that underpins the maintenance of alertness, and facilitates accurate responses to incoming environmental stimuli [26–28].
The other frequency specific activity that consistently distinguished phasic and tonic REM based on scalp and intracranial recordings was γ power (>30 Hz) that seemed to be relatively enhanced during phasic states [20, 21, 24, 29]. Increased γ power during phasic periods might reflect sensorimotor, emotional, and cognitive activity leading to intense dream experiences [29–31]. In fact, phenomenological observations showed that dream reports after phasic periods are more perceptual and hallucinatory-like than those collected after tonic episodes, which, in turn, are more thought-like [11, 32]. Based on these findings, we might assume that during phasic REM, the brain transitionally “decouples” from the external environment and “submerges” in inwardly generated sensory and motor activity, whereas during tonic states, vigilance, environmental awareness, and attentional processes reflecting a more wake-like state are partially reinstated [17, 21, 23].
Large-scale synchronization of oscillatory activity is a crucial mechanism in the formation of functionally connected neuronal ensembles underlying a wide range of cognitive phenomena [33–35]. Accordingly, frequency-specific synchronous oscillations across distant electrode sites can characterize different states of vigilance [36, 37] or cognitive processes that vary in difficulty, attentional demands, or multimodal integration [38–40]. In spite of the advantages of such analyses, apart from one recent study in epileptic patients [41], phasic and tonic REM states were not systematically analyzed in terms of EEG synchronization.
Our aim was to describe interareal (inter- and intrahemispheric) EEG synchronization during phasic and tonic periods based on the weighted phase lag index (WPLI) [42]. In light of the aforementioned data, we assumed that tonic REM sleep was a more wake-like state with enhanced alertness and reinstated attentional processes anticipating environmental stimuli. We were specifically interested in long-range α synchronization that was shown to reflect increased arousal and alertness [25, 36] and to play a key role in cognitive processes that require enhanced attention [38, 39], multisensory integration [40, 43], or top-down control [34, 44]. Here, we show that long-range inter- and intrahemispheric α or β synchrony is enhanced in tonic periods in contrast to phasic ones. On the other hand, increased short-range γ synchrony differentiates phasic from tonic states.
Methods
Participants and procedure
We analyzed nocturnal sleep EEG recordings that were collected in a previous study [21]. Our sample consisted of the polysomnographic data of 20 healthy individuals (10 males, Mage = 21.72 ± 1.36 years). The recordings were collected the second night (after an adaptation night) in the sleep laboratory of the Semmelweis University. Participants were free from prior or current psychiatric, neurological, chronic somatic, or sleep disorders and showed no signs of anxiety or depressive symptoms according to standard psychometric measures. Participants were screened for depressive symptoms by the Hungarian version of the nine-itemed Beck depression inventory (BDI-9 [45]), for anxiety symptoms by the trait score of the adapted version of the Spielberger State-Trait Inventory (STAI-T [46]), and for sleep disorders by the Pittsburgh Sleep Quality Scale (PSQI [47]). Consumption of medicine (except oral contraceptives), alcohol, or drugs also belonged to exclusion criteria. Participants arrived at the laboratory between 20.00 and 21.00 hr and after the placement of electrodes were asked to go to bed at their habitual bedtimes. Before lights off, within a subsample (n = 15) of our participants, resting state EEG with eyes closed was recorded, during which participants were instructed by the assistant to open their eyes for about 10–15 s in every 2 min. Lights off was scheduled between 22.00 and midnight, and participants were allowed to sleep until 8.30 in the morning unless they woke up earlier spontaneously. The data of one participant were excluded because technical artifacts in the electrooculogram (EOG) channel hindered the reliable selection of phasic periods. In addition, the resting state data of two participants were not included due to increased noise generated by muscle artifacts. Therefore, we could only include the data of 12 participants for the analyses of resting state wakeful data. The Ethical Committee of the Semmelweis University approved the study protocol and participants gave written informed consent to the procedure.
Recording and preprocessing
Participants were fitted with gold-coated (Ag/AgCl) scalp electrodes fixed with EC2 Grass Electrode Cream (Grass Technologies, Warwick, Rhode Island, USA). Nineteen scalp EEG derivations (Fp1, Fp2, F7, F3, Fz, F4, F8, T3, C3, Cz, C4, T4, T5, P3, Pz, P4, T6, O1, O2 referenced to the mathematically linked mastoids) as well as bipolar EOG and EMG electrodes were placed according to the standard 10–20 system [48]. Impedances were kept below 8 kΩ. Signals were collected, prefiltered (0.33–1500 Hz, 40 dB/decade antialiasing hardware input filter), amplified, and digitized with 4096 Hz/channel sampling rate (synchronous) with 12-bit resolution by using the 32-channel EEG/polysystem (Brain-Quick BQ 132S; Micromed, Mogliano Veneto, Italy). A further 40 dB/decade antialiasing digital filter was applied by digital signal processing, which low-pass filtered the data at 450 Hz. Finally, the digitized and filtered EEG was resampled to 1024 Hz. Sleep stages were previously scored manually according to standardized criteria of the American Academy of Sleep Medicine (AASM) [49] by an expert trained in sleep research.
Sleep scoring and the inspection of eye movements (EMs) were carried out manually using a custom-made software tool for full night sleep EEG analysis (FerciosEEGPlus, Ferenc Gombos 2008–2017). After the scoring, we extracted the conventional parameters of sleep architecture (see Supplementary Material Table S1).
REM sleep stages from the first four sleep cycles were considered for the selection of phasic and tonic segments. EMs were visually identified in 4 s time windows based on the presence of EOG deflections of an amplitude above 150 µV and shorter than 500 ms. Previous studies used less conservative amplitude criteria [50, 51]; however, EMs in bipolar EOG montages produce higher amplitudes; therefore, we restricted our analyses to relatively larger EMs. The velocity criterion was based on earlier studies indicating that EMs during REM do not exceed 2 Hz in terms of frequency [50, 51].
A 4 s long segment was categorized as phasic if at least two consecutive EMs were detected in adjacent 2 s time windows. Segments were scored as tonic when no EMs occurred (EOG deflections below 25 µV) in adjacent 2 s time windows. In order to rule out possible intermediate periods and the contamination between the two states, phasic and tonic episodes separated from each other by less than two segments (8 s) were discarded. Segments containing technical and movement-related artifacts were visually inspected and excluded from further analyses. Given the larger amount of tonic compared with phasic periods, we randomly selected 100 phasic and 100 tonic segments (400 s) from each participant. In order to increase the stationarity of the data, we cut each 4 s long episode into three 2 s long overlapping (50%) segments. Awake resting state recordings were similarly split into 2 s long overlapping segments. The amount of awake segments was matched (by random selection) to the amount of analyzed REM periods (300 × 2 s). The continuous recordings were filtered by a discrete Fourier transform (DFT) filter removing (50 Hz) line noise and were band-pass filtered (Butterworth, zero phase forward and reverse digital filter between 0.5 and 46 Hz) before frequency analyses. The data were segmented into phasic and tonic trials.
Laplacian estimation
Volume conduction, in general, as well as artifacts produced by microsaccades [52] or muscle activity [53], can largely influence the spatial topography of scalp EEG recordings yielding spurious synchronization even between distant electrode derivations. Therefore, prior to analyses of synchronization, we estimated the surface Laplacian of the EEG data [54–56]. The Laplacian estimation can be interpreted as a spatial filter that attenuates the influence of volume conduction, reference artifacts, and microsaccades and hence provides a more accurate localization of raw EEG signals [56, 57]. Although the WPLI is devoid of the effects of volume conduction originating from common source activity, Laplacian estimation proved to be useful and advisable in order to sharpen EEG topography prior to analyses of interareal synchronization, including the WPLI [39, 58]. We used a spherical spline interpolation (order of splines = 4, maximum degree of Legendre polynomials = 10, λ = 10−5) and calculated the Laplacian, based on the second-order spatial derivatives. Previous work indicates that this procedure minimizes the unfavorable influence of REM-related microsaccades on fast frequency activity [59] and efficiently improves scalp topography even in the case of a small number (19 channels) of electrodes [60].
Frequency decomposition
Spectral power analyses were performed between 4 and 46 Hz (from θ to γ range). We did not analyze slower frequency bins (i.e. within the δ range) due to the negligible contribution of δ oscillations to the differences between phasic and tonic states and due to the fact that slow frequency activity during phasic periods is largely contaminated by EMs rendering δ activity less reliable [20, 21, 51]. Two seconds long, artifact-free, Laplacian transformed phasic, tonic, and awake EEG data segments were tapered (with Hanning window for lower frequencies between 4 and 28 Hz, and by dpss multitaper method with ±2 Hz smoothing for higher frequencies between 29 and 46 Hz). The cross-power spectral densities were computed for each phasic, tonic, and awake trial, based on long-range interhemispheric and (frontoparietal) intrahemispheric channel combinations. Frontopolar and occipital channels were not included to provide a more homogeneous set of distances between pairs. As Figure 1 illustrates, interhemispheric channel pairs included F7-F8, F3-F4, T3-T4, C3-C4, T5-T6, and P3-P4. Intrahemispheric channel pairs included F7-T5, F3-P3, Fz-Pz, F4-P4, and F8-T6.
Figure 1.
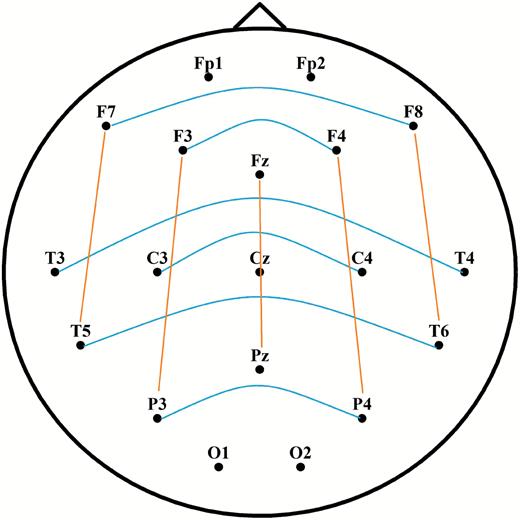
Interhemispheric (blue) and intrahemispheric (orange) channel pairs for the calculation of long-range synchronization. Long-range connections refer to nonadjacent electrode pairs. Frontopolar and occipital electrodes were used for Laplacian estimation, but were excluded from the analyses of synchronization.
Synchronization: WPLI
The phase lag index (PLI) was proposed by Stam and colleagues [61] in order to quantify phase synchronization based on the asymmetry of the distribution of phase-angle differences (usually represented as vectors in a circular plane) between two EEG signals. The PLI, such as the more widely used phase coherence, measures the consistency of phase relationships between two electric signals; however, it is less sensitive to the influence of volume conduction and common sources by discarding random and zero (or π) phase-angle differences [42, 61].
The disadvantage of the PLI is that phase lags might turn into leads, and vice versa, yielding discontinuous measurements that can be problematic in the case of synchronization effects of small magnitude [42]. The modified version of the PLI, the WPLI, was introduced to attenuate this effect. This measure weights phase-angle differences by the magnitude of the imaginary component. Consequently, the procedure attenuates (deweights) the contribution of phase-angle difference vectors that are close to the real axis (close to zero or to π). Although the traditional measure of coherence appears to follow fluctuations in power, WPLI seems to be independent of spectral power [62]. The final estimate of the WPLI produces values between 0 and 1. Values closer to 1 indicate higher phase synchronization between signals [42]. The WPLI was computed for each channel pair and frequency between 4 and 46 Hz (1 Hz bin resolution). Filtering, segmentation, manual artifact rejection, Laplacian estimation, and frequency analyses (FFT and WPLI) were performed in Matlab (The Mathworks) using the Fieldtrip toolbox [63].
Statistical analyses
Statistical testing was performed with R [64]. To reduce the number of statistical comparisons, we averaged the WPLI values of the corresponding channel pairs to obtain a mean value of interhemispheric and intrahemispheric synchronization, separately. WPLI values for the specific frequency bins were averaged into θ (4–7 Hz), α (8–14 Hz), β (15–30 Hz), and γ (31–46 Hz) ranges [65], but binwise values were retained for exploratory analyses. The assumption of normality was verified by the Shapiro–Wilk test in each band and region (inter- and intrahemispheric). Repeated measures analyses of variance (ANOVA) with condition (phasic, tonic) and bands (θ, α, β, γ) as within-subject factors were performed for interhemispheric and intrahemispheric synchronization, separately. The Mauchly’s test was used to verify the assumption of sphericity, and the Greenhouse–Geiser correction on p-values was applied if necessary. Additionally, paired sample t tests were performed to compare bandwise WPLI between phasic and tonic conditions. To address the issue of multiple comparisons, we applied the Benjamini–Hochberg procedure to estimate false discovery rate [66], and we report corrected p-values throughout the text. In order to examine whether phasic or tonic differences in α-band synchrony were specific for long-range synchronization, we performed two post hoc analyses. We calculated a grand average WPLI including all channel combinations (yielding 171 pairs of the 19 channels) and an average WPLI based only on short-range (adjacent) electrode combinations (yielding 26 channel pair combinations; e.g. Fp1-F7, F3-C3, C3-P3, F3-F7, T3-T5, T5-P3). The above statistical tests (ANOVAs and t tests) were performed similarly on these outcome measures. Binwise data of phasic or tonic REM and resting wakefulness were compared by bootstrap tests (permutation test). This approach is suitable to analyze sleep EEG data since it makes no assumptions of the distribution of the data [67–69]. Bootstrap tests in case of each frequency bin (from 4 to 46 Hz) and region (inter- and intrahemispheric WPLI) were based on 10000 random samples derived from the original pool of data (bootstrap distribution). Previous studies showed that such nonparametric tests are efficient in handling false alarm rate [70].
Results
Long-range synchronization
Inter- and intrahemispheric WPLI values of all frequency bands did not deviate from normal distribution as verified by Shapiro–Wilk tests (all p > 0.2). In case of interhemispheric synchronization, the main effect of condition showed a trend (F1,18 = 4.35, p = 0.05, η2= 0.19), and the effect of bands was not significant (F3,54 = 1.72, p = 0.17), but a significant interaction between condition and bands emerged explaining 13% of the variance in WPLI values (F3,54 = 2.85, p = 0.04, η2= 0.13). As shown in Figure 2, post hoc comparisons between phasic and tonic conditions indicated that WPLI in the α range was significantly higher in tonic in comparison to phasic periods (t18 = −2.8, p < 0.05). Differences in other frequency bands were not significant (all p > 0.05). Nevertheless, there was one outlier within the tonic β band based on the interquartile range rule with a multiplier of 2.2 [71]; therefore, we repeated the above analyses excluding the outlier. The exclusion of the outlier did not change our results, except for the β band, that showed a significant difference between phasic and tonic conditions (t17 = −2.72, p = 0.04, d = 0.64). Statistical parameters of paired comparisons (including the outlier) are summarized in Table 1.
Table 1.
Paired sample t tests (n = 19) contrasting bandwise long-range interhemispheric and long-range intrahemispheric WPLI in phasic and tonic REM sleep
†Long-range interhemispheric WPLI within the β range was significantly higher in tonic vs. phasic REM after the exclusion of one outlier (see Long-range synchronization).
Figure 2.

Long-range interhemispheric and intrahemispheric WPLI in phasic and tonic REM periods in different frequency bands. Dots show individual data points, the vertical line within the boxes shows the medians, boxes represent the first and third quartiles, and whiskers indicate the interquartile range of 1.5. *Statistical parameters after the exclusion of the outlier.
Regarding intrahemispheric synchronization, the main effect of condition was significant explaining a large portion of the variance in the outcome measure (F1,18 = 19.8, p < 0.001, η2= 0.52). The effect of bands was not significant (F3,54 = 1.48, p = 0.23), but the interaction between condition and bands yielded a significant effect (F3,54 = 5.35, p = 0.003, η2= 0.23). Post hoc comparisons showed that WPLI in the α- (t18 = −4.76, p = 0.0006) and β- (t18 = −4.01, p = 0.002) frequency bands were significantly different across phasic and tonic periods, both showing higher values in tonic in comparison to phasic REM sleep (see Figure 2 and Table 1). The exclusion of outliers (n = 2) did not modify the results of the statistical tests.
WPLI in REM states compared with wakefulness
In order to explore peak frequencies and frequency specific increases in long-range synchronization, we visualized WPLI in phasic and tonic REM states from 4 to 46 Hz. As shown in Figure 3, interhemispheric synchronization was relatively higher in tonic conditions, especially in frequencies pertaining to the high α and β ranges (12–16 and 28–31 Hz). In case of intrahemispheric synchronization, tonic REM showed relative increases in several frequency bins (5–6, 9–10, 13–16, and 25–31 Hz), except in those that belong to the γ range.
Figure 3.

Inter- and intrahemispheric WPLI in phasic and tonic REM sleep between 4 and 46 Hz (1 Hz resolution). The line graph depicts the mean values of 19 participants in each frequency bin. Vertical lines indicate standard errors. Black horizontal lines correspond to bins that are significantly different (p < 0.05) between phasic and tonic conditions.
To compare inter- and intrahemispheric synchronization during wakefulness with that of phasic and tonic REM states, we visualized binwise WPLI in these three vigilance states, based on the data of our subsample (n = 12) in which wakeful resting state recordings were also available. Due to the large amount of muscle-related and technical artifacts that affected specifically high-frequency activity in recordings collected during the awake state, in this case, binwise WPLI was visualized only until 27 Hz (Figure 4). Wakefulness was characterized by increased inter- and intrahemispheric synchronization within the α range, peaking around 10 Hz. Although WPLI in the α-frequency range was markedly increased in resting wakefulness, compared with REM sleep periods, tonic REM, particularly in case of intrahemispheric synchronization, exhibited an intermediate state between wakefulness and phasic REM sleep in this regard. Furthermore, long-range synchronization within the β range exhibited overlapping values between wakefulness and tonic REM sleep, exceeding the values found in phasic REM (see Figure 4).
Figure 4.
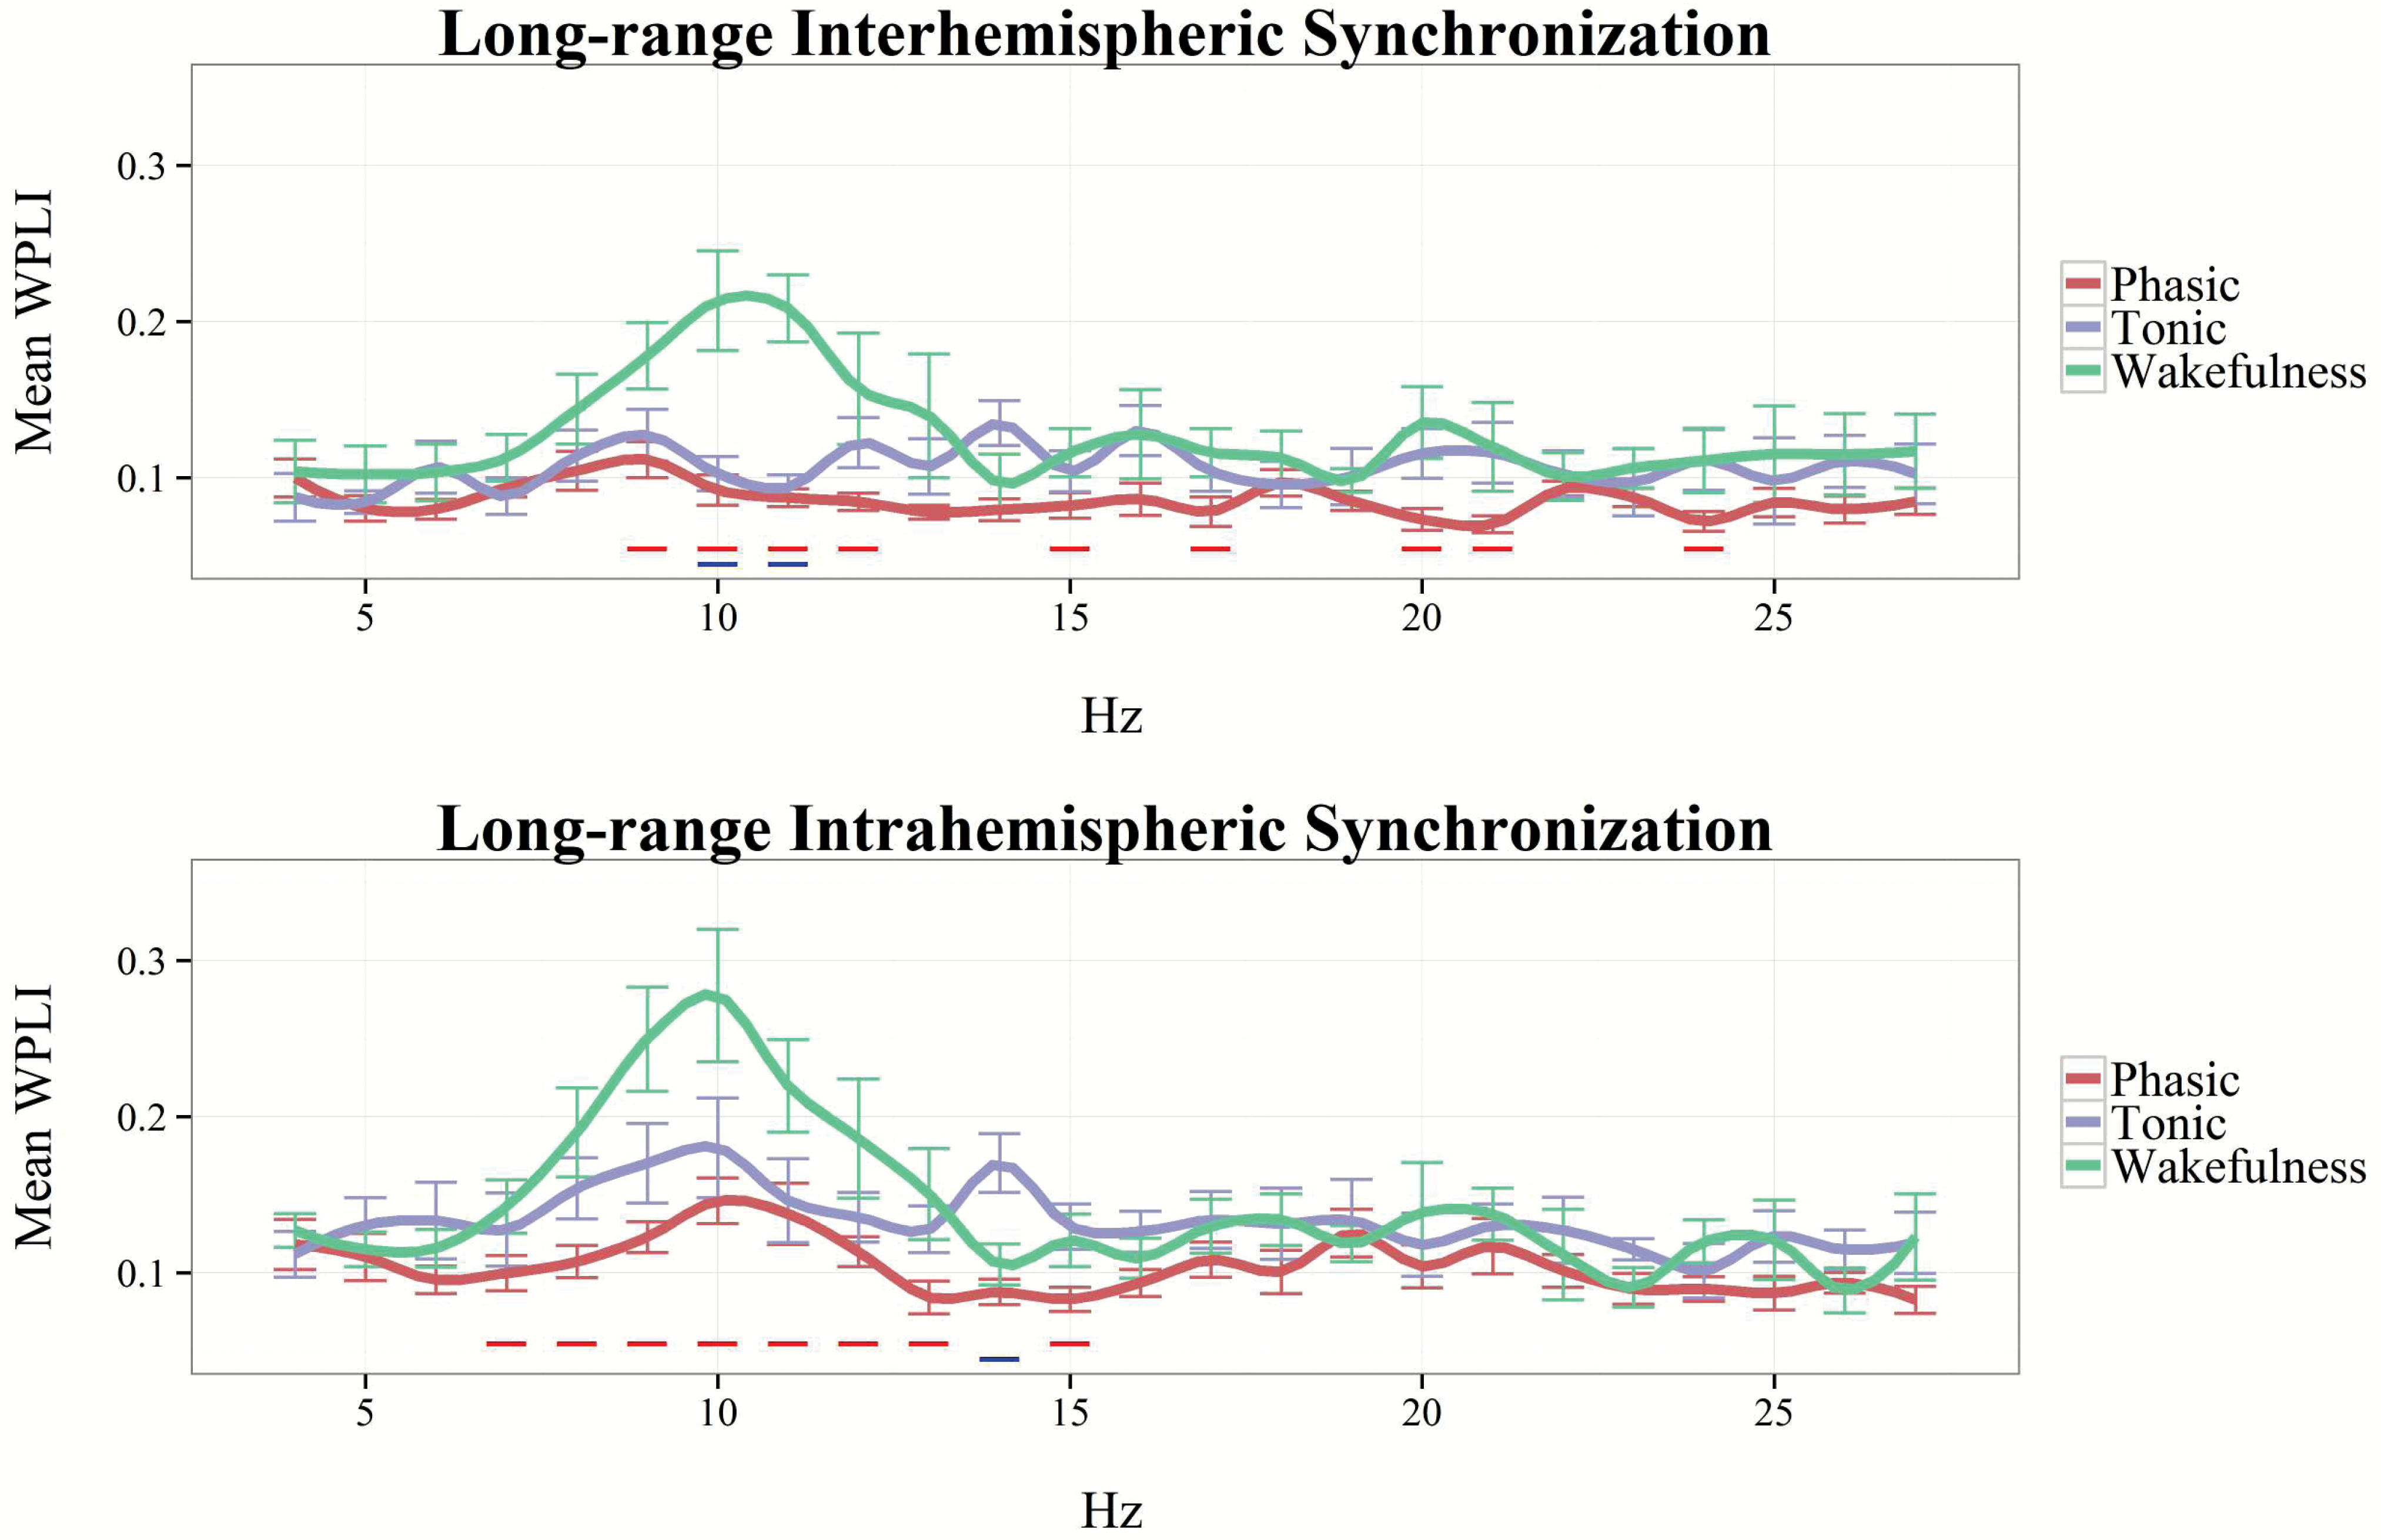
Inter- and intrahemispheric WPLI in phasic REM, tonic REM, and resting wakefulness, between 4 and 27 Hz (1 Hz resolution). The linegraph (smoothed for visualization) depicts the mean values of 12 participants in each frequency bin. Vertical lines indicate standard errors. Blue horizontal lines correspond to statistically significant differences between tonic REM and wakefulness. Red horizontal lines correspond to statistically significant differences between phasic REM and wakefulness.
Grand average and short-range WPLI
To verify whether the above differences between phasic and tonic conditions in α or β synchronization were specific to long-range synchrony, we first computed a grand average of bandwise synchronization by averaging WPLI values of all channel combinations. The repeated measures ANOVA for this outcome measure yielded a significant main effect of band (F3,54 = 11.64, p < 0.0001, η2= 0.41) and a significant interaction between condition and band (F3,54 = 13.34, p < 0.0001, η2= 0.46), whereas the main effect of condition (F1,18 = 2.35, p = 0.14) was not significant. Paired comparisons revealed significantly higher WPLI in phasic REM in case of the γ (t18 = 5.45, p < 0.001, Cohens’ d = 1.25) band, whereas increased synchronization was found in the β range (t18 = −2.63, p < 0.05, Cohens’ d = 0.61) during the tonic state. Differences in the α band were not significant (t18 = −1.58, p > 0.1, Cohens’ d = 0.36).
As the grand average of WPLI including all channel pair combinations intermingles long- and short-range synchronization, we extracted bandwise short-range synchronization averaging WPLI values of only adjacent electrode pairs (e.g. F3-C3, C3-P3, F4-F8, P3-T5). In case of short-range WPLI, the main effect of condition (F1,18 = 18.71, p < 0.001, η2= 0.51), band (F3,54 = 12.16, p < 0.0001, η2= 0.4), and their interaction (F3,54 = 13.76, p < 0.0001, η2= 0.45) were significant. Paired t tests indicated relatively increased WPLI values in the phasic condition compared with the tonic state within the γ (t18 = 6.74, p < 0.00001, Cohens’ d = 1.54) band. In contrast to long-range synchrony, WPLI within the α- and β-frequency ranges did not differentiate phasic and tonic conditions (Figure 5 and Supplementray Table S2).
Figure 5.

Average WPLI of adjacent (short-range) electrode combinations in phasic and tonic REM periods in different frequency bands. Dots show individual data points, the vertical line within the boxes shows the medians, boxes represent the first and third quartiles, whiskers indicate the interquartile range of 1.5.
Topographical aspects
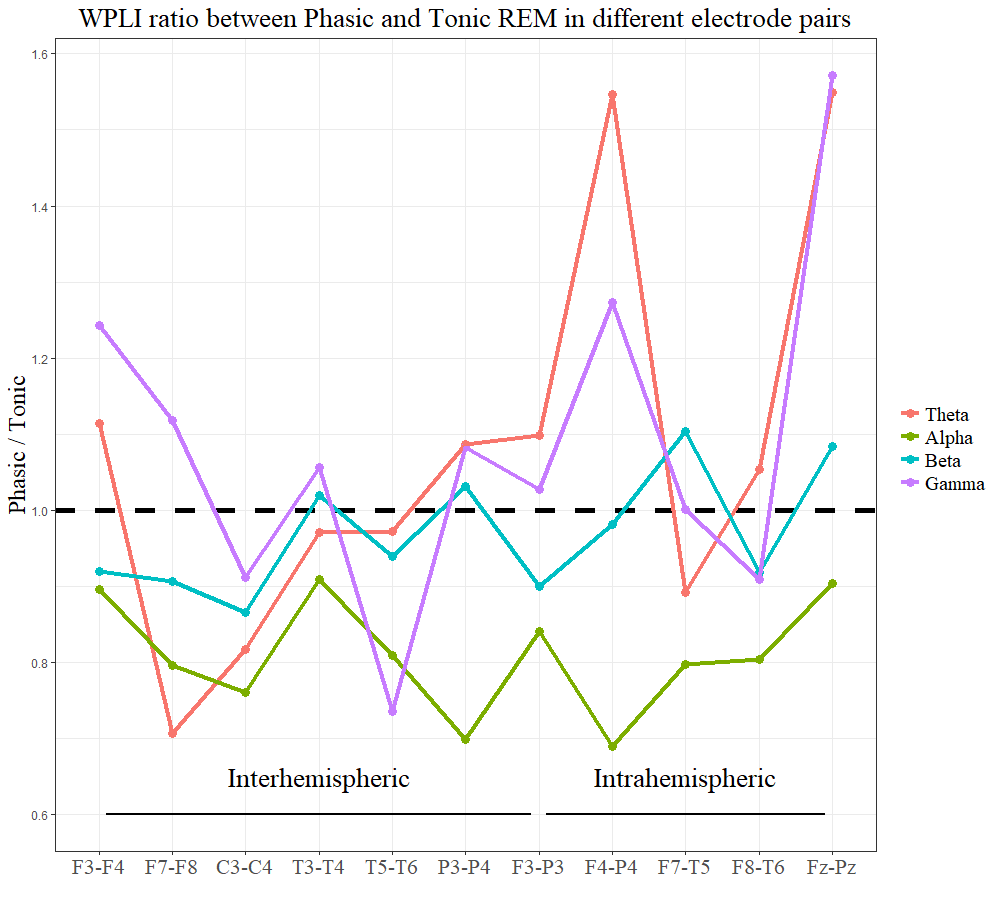
In order to examine (on an exploratory level) the topographical aspects of EEG synchronization, we contrasted phasic and tonic WPLI values of each interhemispheric and intrahemispheric electrode pair. WPLI within the α band showed consistently higher values in tonic REM in all electrode combinations, peaking at posterior interhemispheric pairs (P3-P4). WPLI within the β band showed “tonic peaks” at left frontoparietal (F3-P3), right frontotemporal (F8-T6), and central interhemispheric derivations (C3-C4). Although the averages of inter- and intrahemispheric long-range synchronization in θ and γ ranges were not significant (see Long-range synchronization), frontoparietal θ and γ synchronization (in two electrode pairs: F4-P4, Fz-Pz) showed clear peaks in phasic REM. Long-range synchronization in different frequency bands and electrode pairs is visualized in Supplementary Figure S1.
Additionally, we analyzed average WPLI values in anterior, central, and posterior regions, by computing the mean WPLI score of all possible electrode combinations of these regions. In case of the anterior region, the main effects of condition (F1,18 = 7.20, p = 0.02, η2= 0.23) and band (F3,54 = 12.18, p < 0.0001, η2= 0.29) were significant, as well as the interaction between condition and band (F3,54 = 24.96, p < 0.0001, η2= 0.6). Post hoc comparisons showed increased γ synchronization (t18 = 5.3, p < 0.0005, Cohens’ d = 1.23) in phasic, and a trend of higher α synchronization (t18 = −2.48, p = 0.08, Cohens’ d = 0.54) in tonic REM. In central channel pairs, only the effect of band (F3,54 = 17.38, p < 0.0001, η2= 0.48) was significant, but condition (F1,18 = 0.08, p = 0.78) and condition × band (F1,18 = 1.63, p = 019) were not significant factors of the model. Accordingly, no significant differences between phasic and tonic states emerged in any frequency band (Supplementary Table S3). Similarly, in case of posterior channel pairs, only the main effect of band was significant (F3,54 = 19.38, p < 0.0001, η2= 0.5248), whereas no significant effect of condition (F1,18 = 0.05, p = 0.82) or of condition × band (F1,18 = 2.35, p = 0.08) emerged. The only band differentiating phasic and tonic conditions was γ showing a trend (t18 = 2.62, p = 0.08, Cohens’ d = 0.6) of higher synchronization in phasic REM (Supplementary Table S3).
Discussion
In this study, we examined frequency-specific cortical synchronization in phasic and tonic REM sleep. Our analyses indicate that inter- and intrahemispheric α and β synchrony as quantified by the WPLI is enhanced in tonic REM states in contrast to phasic ones. In case of short-range synchronization, however, WPLI in the γ-frequency range is higher in phasic compared with tonic periods.
Our findings complement and extend earlier studies that emphasized the differences between these two microstates in terms of alertness [5], environmental processing [16], neuronal network activity [17] and mental experiences [11]. Phasic and tonic REM sleep shows marked differences in EEG spectral power: α and β oscillations are increased during the tonic state, whereas γ power is relatively enhanced during the phasic state [20–23]. Beyond local EEG power, phase synchronization between distant electrode sites reflects functional coupling and integration between cortical regions [33, 34, 72]. Accordingly, frequency-specific phase synchronization between distant cortical regions clearly distinguished different states of vigilance, including non-REM (NREM) sleep, REM sleep, and wakefulness [67, 73, 74].
Here, we extended this line of inquiry to examine cortical synchronization between phasic and tonic REM sleep, and focused on long-range α synchronization as it has been linked to the frontoparietal network supporting alertness, attention, and top-down control [34, 38, 44, 75]. In line with our expectations, we found increased inter- and intrahemispheric long-range α synchronization during tonic in contrast to phasic REM sleep. Additionally, relatively increased synchronization was evidenced within the tonic state in faster frequencies comprising the β range. Our analyses indicated that these differences were specific to long-range synchrony, as short-range synchronization in the α and β ranges was not significantly different across phasic and tonic conditions.
Long-range inter- and intrahemispheric α synchronization is a prominent feature of a variety of cognitive processes that characterize the awake state [44]; therefore, it is tempting to speculate that increased long-range α synchronization found in the tonic state supports the assumption that tonic REM sleep resembles wakefulness. In fact, long-range WPLI values showed a prominent peak within the α range during resting wakefulness, and intrahemispheric α synchrony in tonic REM exhibited intermediate values between phasic REM and wakefulness. Our data corroborate the findings of two previous studies showing increased synchrony in the α range during (eyes closed) wakefulness compared with REM sleep (although these studies applied phase coherence [59] and global field synchronization [67], as measures of synchronization). Although phasic REM periods are characterized by reduced long-range α synchrony, our findings suggest that inter- and intrahemispheric α synchronization is partially reinstated during tonic REM states. Long-range α synchronization during tonic states might restore sensory awareness and responsiveness [34] after phasic periods in which the brain temporarily decouples from the external environment [17]. It is important to note that enhanced long-range synchronization in the tonic state was also found in the β band. Although increased α synchronization in tonic REM seemed to be a consistent pattern of all examined electrode pairs, higher β band synchrony was evident among frontocentral interhemispheric, as well as frontoparietal, and frontotemporal intrahemispheric electrode pairs. This finding coheres with other studies indicating that frontoparietal network activity is not constrained to α oscillations, but extends to the β range [25, 40, 76, 77].
Reduced inter- and intrahemispheric synchronization between distant cortical ensembles during phasic REM sleep might be related to attenuated environmental processing as reflected by increased awakening threshold and attenuated cortical reactivity in response to external stimulation [5, 16, 17]. On the other hand, enduring external stimulation seems to suppress phasic REM sleep and triggers tonic REM, presumably due to the reengagement of frontoparietal attentional networks [17, 18]. Reduced long-range synchrony during phasic REM is also in line with clinical data indicating that phasic REM periods have a suppressing effect on interictal epileptiform discharges [41, 78], as epileptic activity seems to be facilitated by wide-spread neuronal synchronization [79].
Although long-range α or β synchrony decreased, γ synchronization between the adjacent electrode sites was relatively enhanced during phasic REM periods. Oscillations in the γ range were consistently reported in phasic REM sleep [21, 30, 80]. Our findings complement these data and suggest that these oscillations may arise from local instead of wide-spread cortical regions. Although we can only speculate about the underlying mechanism of such oscillations, we might assume that these are driven by cholinergic and glutamatergic activity linked to PGO waves. First of all, cholinergic and glutamatergic projections have a crucial role in the generation of phasic REM sleep [81–84]. Moreover, a large amount of data indicate that ascending cholinergic and glutamatergic activity facilitates γ oscillations in the neocortex during wakefulness and REM sleep [85–89]. Increased γ synchronization during phasic periods was prominent between anterior electrode pairs. Nevertheless, given the lack of similar findings, further studies should corroborate whether phasic γ synchronization is specifically enhanced in frontal regions.
Increased short-range γ synchrony might reflect intense limbic and sensorimotor activity during phasic REM sleep leading to highly emotional and perceptually vivid dream experiences [11, 32, 90]. On the other hand, synchronization of cortical ensembles within the γ bands might be related to mechanisms facilitating neural plasticity and memory-consolidation [91] that might also influence mental activity during sleep. Nevertheless, information-processing and mental activity during phasic REM sleep in relation to frequency-specific synchronization is far from being understood and needs to be addressed in future studies.
Interestingly, in case of long-range synchrony, the main effect of frequency band was not significant, indicating the lack of a frequency gradient in synchronization when REM microstates were treated as a whole. This finding is apparently at odds with a previous study indicating clear peaks in synchronization during REM as measured by global field synchrony [67], but resembles the finding of another study showing no evident peaks in coherence during REM sleep after Laplacian transformation [59]. Given the paucity of previous studies in this regard, as well as the differences in the applied methodologies, it is not easy to explain the lack of differences between frequency bands. Nevertheless, it seems plausible that frequency-specific peaks in long-range synchronization do not overlap in phasic and tonic conditions (as it was apparent in the binwise analysis (Figure 3), and hence, the main effects of frequency bands were masked due to these differences. In sharp contrast to long-range synchronization, a pronounced main effect of frequency band did emerge in case of short-range synchrony. We might assume that local cortical activity (and hence, frequency-specific variations in amplitude) might contribute to increased synchronization between electrode sites that are close to each other. Moreover, we should note that measures of synchronization between adjacent electrodes are less immune to the effects of field spread even when these are mitigated by Laplacian transformation and by discarding zero phase lags [92]. This might explain why our measures of short-range synchronization resemble more the frequency gradient of spectral power measures [21].
We showed that frequency-specific coherent activity among local and distant neural ensembles differentiates phasic from tonic REM periods and provides further evidence on the heterogeneity of REM sleep. We applied a measure of synchronization that is independent of the fluctuations of spectral power [62] and showed that beyond the differences in spectral power [20–22], different frequencies show different topographical patterns of synchronization during tonic and phasic REM periods.
Among the limitations of our work, we should note that our analyses are based on a relatively low number of electrode combinations. Therefore, our findings, especially the topographical aspects, should be corroborated by future studies that apply high density EEG or intracerebral recordings allowing for a more precise analyses of long- and short-range synchronization. Furthermore, we should emphasize that the assumption of partially reinstated alertness during tonic REM periods is still speculative and needs to be examined in further experiments that involve direct measurements of attentional processes during tonic and phasic REM periods. Accordingly, the functional significance of the alternation between phasic and tonic microstates within REM sleep remains unanswered. Interestingly, in contrast to REM sleep, the heterogeneity of NREM sleep regarding sleep stability and arousability is relatively well established [93]. These studies suggest that the dynamic structure of NREM sleep reflects two opposing, but at the same time complementary processes: an “offline” mode promoting the stability of sleep as well as internal memory processing and an “online” mode facilitating environmental alertness [93, 94]. The interchange of two microstates within REM sleep might reflect a similar process, alternating between phasic REM periods featured by intrinsic neuronal activity and reduced sensory processing [17], and tonic states characterized by reinstated environmental alertness.
Funding
The project was supported by the ÚNKP-17-4 New National Excellence Program of the Ministry of Human Capacities. P.S. was supported by the Hungarian Scientific Research Fund (NKFI PD 115432) of the National Research, Development and Innovation Office.
Notes
Conflicts of interest statement. None declared.
Work Performed: Department of Affective Psychology, Eötvös Loránd University and Semmelweis University, Institute of Behavioural Sciences, Budapest, Hungary
References
- Carskadon MA et al. Monitoring and staging human sleep. In: Kryger MH, Roth T, Deent WC, eds. Principles and Practice of Sleep Medicine, 5th ed. St. Louis: Elsevier Saunders; 2011: 16–26.
- Jouvet M. Paradoxical sleep—a study of its nature and mechanisms. Prog Brain Res 1965;18:20–62.
- Andrillon T et al. Single-neuron activity and eye movements during human REM sleep and awake vision. Nat Commun 2015;6:7884.
- Aserinsky E et al. Regularly occurring periods of eye motility, and concomitant phenomena, during sleep. Science 1953;118(3062):273–274.
- ErmisUet al. Arousal thresholds during human tonic and phasic REM sleep. J Sleep Res 2010;19(3):400–406.
- MaquetPet al. Human cognition during REM sleep and the activity profile within frontal and parietal cortices: a reappraisal of functional neuroimaging data. Prog Brain Res 2005;150:219–227.
- MaquetPet al. Functional neuroanatomy of human rapid-eye-movement sleep and dreaming. Nature 1996;383(6596):163–166.
- OgawaKet al. Phasic brain activity related to the onset of rapid eye movements during rapid eye movement sleep: study of event-related potentials and standardized low-resolution brain electromagnetic tomography. J Sleep Res 2010;19(3):407–414.
- OgawaKet al. Temporal coupling of rapid eye movements and cerebral activities during REM sleep. Clin Neurophysiol 2009;120(1):18–23.
- Ktonas P et al. Two-minute rapid eye movement (REM) density fluctuations in human REM sleep. Neurosci Lett 2003;353(3):161–164.
- Molinari S et al. Tonic and phasic events during sleep: psychological correlates and implications. Percept Mot Skills 1969;29(2):343–368
- Moruzzi G. Active processes in the brain stem during sleep. Harvey Lect 1963;58:233–297
- Pompeiano O. The neurophysiological mechanisms of the postrual and motor events during desynchronized sleep. Res Publ Assoc Res Nerv Ment Dis 1967; 45:351–423.
- Callaway CW et al. Pontogeniculooccipital waves: spontaneous visual system activity during rapid eye movement sleep. Cell Mol Neurobiol 1987;7(2):105–149
- Price LJ et al. Variations in behavioral response threshold within the REM period of human sleep. Psychophysiology 1980;17(2):133–140.
- Sallinen M et al. Processing of auditory stimuli during tonic and phasic periods of REM sleep as revealed by event-related brain potentials. J Sleep Res 1996;5(4):220–228.
- Wehrle R et al. Functional microstates within human REM sleep: first evidence from fMRI of a thalamocortical network specific for phasic REM periods. Eur J Neurosci 2007;25(3):863–871.
- Stuart K et al. Auditory inhibition of rapid eye movements and dream recall from REM sleep. Sleep 2009;32(3):399–408.
- Sämann PG et al. Development of the brain’s default mode network from wakefulness to slow wave sleep. Cereb Cortex NYN 1991 2011;21(9):2082–2093.
- Jouny C et al. EEG spectral activity during paradoxical sleep: further evidence for cognitive processing. Neuroreport 2000;11(17):3667–3671.
- Simor P et al. EEG spectral power in phasic and tonic REM sleep: different patterns in young adults and children. J Sleep Res 2016;25(3):269–277.
- Waterman D et al. EEG spectral power analysis of phasic and tonic REM sleep in young and older male subjects. J Sleep Res 1993;2(1):21–27.
- De Carli F et al. Activation of the motor cortex during phasic rapid eye movement sleep. Ann Neurol 2016;79(2):326–330.
- Nishida M et al. High frequency activities in the human orbitofrontal cortex in sleep-wake cycle. Neurosci Lett 2005;379(2):110–115.
- Sadaghiani S et al. Intrinsic connectivity networks, alpha oscillations, and tonic alertness: a simultaneous electroencephalography/functional magnetic resonance imaging study. J Neurosci 2010; 30(30):10243–10250.
- Jung TP et al. Estimating alertness from the EEG power spectrum. IEEE Trans Biomed Eng 1997;44(1):60–69.
- Makeig S et al. Lapses in alertness: coherence of fluctuations in performance and EEG spectrum. Electroencephalogr Clin Neurophysiol 1993;86(1):23–35.
- Makeig S et al. Changes in alertness are a principal component of variance in the EEG spectrum. Neuroreport 1995;7(1):213–216.
- Gross DW et al. Correlation of high-frequency oscillations with the sleep-wake cycle and cognitive activity in humans. Neuroscience 1999; 94(4):1005–1018.
- Corsi-Cabrera M et al. Human amygdala activation during rapid eye movements of rapid eye movement sleep: an intracranial study. J Sleep Res 2016;25(5):576–582.
- Llinás R et al. Coherent 40-Hz oscillation characterizes dream state in humans. Proc Natl Acad Sci U S A 1993;90(5):2078–2081.
- Pivik RT. Tonic states and phasic events in relation to sleep mentation. In: Ellman SJ, Antrobus JS, eds. The Mind in Sleep: Psychology and Physiology. 2nd ed. New York: J. Wiley; 1991:214–247.
- Fries P. Rhythms for cognition: communication through coherence. Neuron 2015;88(1):220–235.
- Palva S et al. New vistas for alpha-frequency band oscillations. Trends Neurosci 2007;30(4):150–158.
- Varela F et al. The brainweb: phase synchronization and large-scale integration. Nat Rev Neurosci 2001;2(4):229–239.
- Cantero JL et al. Alpha EEG coherence in different brain states: an electrophysiological index of the arousal level in human subjects. Neurosci Lett 1999;271(3):167–170.
- Cantero JL et al. The role of neural synchronization in the emergence of cognition across the wake-sleep cycle. Rev Neurosci 2005;16(1):69–83.
- Doesburg SM et al. From local inhibition to long-range integration: a functional dissociation of alpha-band synchronization across cortical scales in visuospatial attention. Brain Res 2009;1303:97–110.
- van Driel J et al. Local and interregional alpha EEG dynamics dissociate between memory for search and memory for recognition. Neuroimage 2017;149:114–128.
- von Stein A et al. Different frequencies for different scales of cortical integration: from local gamma to long range alpha/theta synchronization. Int J Psychophysiol 2000;38(3):301–313.
- Campana C et al. Suppression of interictal spikes during phasic rapid eye movement sleep: a quantitative stereo-electroencephalography study. J Sleep Res 2017;26(5):606–613.
- Vinck M et al. An improved index of phase-synchronization for electrophysiological data in the presence of volume-conduction, noise and sample-size bias. Neuroimage 2011;55(4):1548–1565.
- von Stein A et al. Top-down processing mediated by interareal synchronization. Proc Natl Acad Sci U S A 2000;97(26):14748–14753.
- Palva S et al. Functional roles of alpha-band phase synchronization in local and large-scale cortical networks. Front Psychol 2011;2:204.
- Rózsa S et al. Psychometric properties of the Hungarian version of the shortened Beck Depression Inventory. Psychiatr Hung 2001;16(4):384–402.
- Sipos K et al. A state-trait anxiety inventory (STAI) magyar változata. Pszichodiagnosztikai Vadem 1994; 2.
- Takács J et al. Reliability and validity of the Hungarian version of the Pittsburgh Sleep Quality Index (PSQI-HUN): comparing psychiatric patients with control subjects. Sleep Breath 2016;20(3):1045–1051.
- Jasper H. Report of the committee on methods of clinical examination in electroencephalography. Electroencephalogr Clin Neurophysiol 1958;10:370–375.
- Berry RB et al. The AASM Manual for the Scoring of Sleep and Associated Events: Rules, Terminology and Technical Specifications. Darien, IL: American Academy of Sleep Medicine; 2012. http://www.aasmnet.org/resources/pdf/scoring-manual-preface.pdf. Accessed May 15, 2017.
- Darchia N et al. Rapid eye movement density is reduced in the normal elderly. Sleep 2003;26(8):973–977.
- Tan X et al. A simple method for computer quantification of stage REM eye movement potentials. Psychophysiology 2001; 38(3):512–516.
- Yuval-Greenberg S et al. Transient induced gamma-band response in EEG as a manifestation of miniature saccades. Neuron 2008;58(3):429–441.
- Whitham EM et al. Scalp electrical recording during paralysis: quantitative evidence that EEG frequencies above 20 Hz are contaminated by EMG. Clin Neurophysiol 2007;118(8):1877–1888.
- Perrin F et al. Spherical splines for scalp potential and current density mapping. Electroencephalogr Clin Neurophysiol 1989;72(2):184–187.
- Kayser J et al. Issues and considerations for using the scalp surface Laplacian in EEG/ERP research: a tutorial review. Int J Psychophysiol Off J Int Organ Psychophysiol 2015;97(3): 189–209.
- Srinivasan R et al. EEG and MEG coherence: measures of functional connectivity at distinct spatial scales of neocortical dynamics. J Neurosci Methods 2007;166(1):41–52.
- Tenke CE et al. Generator localization by current source density (CSD): Implications of volume conduction and field closure at intracranial and scalp resolutions. Clin Neurophysiol Off J Int Fed Clin Neurophysiol 2012;123(12):2328–2345.
- Cohen MX. Effects of time lag and frequency matching on phase-based connectivity. J Neurosci Methods 2015;250:137–146.
- Voss U et al. Lucid dreaming: a state of consciousness with features of both waking and non-lucid dreaming. Sleep 2009;32(9):1191–1200.
- Kayser J et al. Principal components analysis of Laplacian waveforms as a generic method for identifying ERP generator patterns: II. Adequacy of low-density estimates. Clin Neurophysiol 2006;117(2):369–380.
- Stam CJ et al. Phase lag index: assessment of functional connectivity from multi channel EEG and MEG with diminished bias from common sources. Hum Brain Mapp 2007;28(11):1178–1193.
- Ortiz E et al. Weighted phase lag index and graph analysis: preliminary investigation of functional connectivity during resting state in children. Comput Math Methods Med 2012;2012:186353.
- Oostenveld R et al. FieldTrip: Open source software for advanced analysis of MEG, EEG, and invasive electrophysiological data. Comput Intell Neurosci 2011;2011:156869.
- Team RC. R: A Language and Environment for Statistical Computing. Vienna, Austria: R Foundation for Statistical Computing. 2014.
- Noachtar S et al. A glossary of terms most commonly used by clinical electroencephalographers and proposal for the report form for the EEG findings. The International Federation of Clinical Neurophysiology. Electroencephalogr Clin Neurophysiol Suppl 1999;52:21–41.
- Benjamini Y et al. Controlling the false discovery rate: a practical and powerful approach to multiple testing. J R Stat Soc Ser B Methodol 1995;57(1):289–300.
- Achermann P et al. Global field synchronization reveals rapid eye movement sleep as most synchronized brain state in the human EEG. R Soc Open Sci 2016;3(10):160201.
- De Gennaro L et al. Slow eye movements and EEG power spectra during wake-sleep transition. Clin Neurophysiol 2000;111(12):2107–2115.
- Tarokh L et al. Developmental changes in brain connectivity assessed using the sleep EEG. Neuroscience 2010;171(2):622–634.
- Maris E et al. Nonparametric statistical testing of EEG- and MEG-data. J Neurosci Methods 2007;164(1):177–190.
- Hoaglin DC et al. Fine-tuning some resistant rules for outlier labeling. J Am Stat Assoc 1987;82(400):1147–1149.
- Singer W. Coherence as an organizing principle of cortical functions. Int Rev Neurobiol 1994;37:153–83; discussion 203.
- Castro S et al. Inter-hemispheric coherence of neocortical gamma oscillations during sleep and wakefulness. Neurosci Lett 2014;578:197–202.
- Pérez-Garci E et al. Paradoxical sleep is characterized by uncoupled gamma activity between frontal and perceptual cortical regions. Sleep 2001;24(1):118–126.
- Sadaghiani S et al. α-band phase synchrony is related to activity in the fronto-parietal adaptive control network. J Neurosci 2012;32(41):14305–14310.
- Palva JM et al. Neuronal synchrony reveals working memory networks and predicts individual memory capacity. Proc Natl Acad Sci U S A 2010;107(16):7580–7585.
- Palva JM et al. Phase synchrony among neuronal oscillations in the human cortex. J Neurosci 2005;25(15):3962–3972.
- Frauscher B et al. EEG desynchronization during phasic REM sleep suppresses interictal epileptic activity in humans. Epilepsia 2016;57(6):879–888.
- Frauscher B et al. Facilitation of epileptic activity during sleep is mediated by high amplitude slow waves. Brain J Neurol 2015;138(Pt 6):1629–1641.
- Brankačk J et al. Distinct features of fast oscillations in phasic and tonic rapid eye movement sleep. J Sleep Res 2012;21(6):630–633.
- Carroll C et al. Effects of pontine lesions on REM sleep. Curr Neurol Neurosci Rep 2014;14(7):460.
- Datta S et al. Microinjection of glutamate into the pedunculopontine tegmentum induces REM sleep and wakefulness in the rat. Am J Physiol Regul Integr Comp Physiol 2001;280(3):R752–R759.
- Luppi PH et al. The neuronal network responsible for paradoxical sleep and its dysfunctions causing narcolepsy and rapid eye movement (REM) behavior disorder. Sleep Med Rev 2011;15(3):153–163.
- Van Dort CJ et al. Optogenetic activation of cholinergic neurons in the PPT or LDT induces REM sleep. Proc Natl Acad Sci U S A 2015;112(2):584–589.
- Cape EG et al. Neurotensin-induced bursting of cholinergic basal forebrain neurons promotes gamma and theta cortical activity together with waking and paradoxical sleep. J Neurosci 2000;20(22):8452–8461.
- Cape EG et al. Effects of glutamate agonist versus procaine microinjections into the basal forebrain cholinergic cell area upon gamma and theta EEG activity and sleep-wake state. Eur J Neurosci 2000;12(6):2166–2184.
- Jones BE. From waking to sleeping: neuronal and chemical substrates. Trends Pharmacol Sci 2005;26(11):578–586.
- Lee MG et al. Cholinergic basal forebrain neurons burst with theta during waking and paradoxical sleep. J Neurosci 2005;25(17):4365–4369.
- Rodriguez R et al. Short- and long-term effects of cholinergic modulation on gamma oscillations and response synchronization in the visual cortex. J Neurosci 2004;24(46):10369–10378.
- Goodenough DR et al. Some correlates of dream reporting following laboratory awakenings. J Nerv Ment Dis 1965;140:365–373.
- Popa D et al. Coherent amygdalocortical theta promotes fear memory consolidation during paradoxical sleep. Proc Natl Acad Sci U S A 2010;107(14):6516–6519.
- Bastos AM et al. A tutorial review of functional connectivity analysis methods and their interpretational pitfalls. Front Syst Neurosci 2015;9:175.
- Halász P et al. Two features of sleep slow waves: homeostatic and reactive aspects–from long term to instant sleep homeostasis. Sleep Med 2014;15(10):1184–1195.
- Lecci S et al. Coordinated infraslow neural and cardiac oscillations mark fragility and offline periods in mammalian sleep. Sci Adv 2017;3(2):e1602026.
© Sleep Research Society 2017. Published by Oxford University Press on behalf of the Sleep Research Society. All rights reserved. For permissions, please e-mail journals.permissions@oup.com
Supplementary figure
Figure S1. Long-range synchronization in different frequency bands and electrode pairs. The y-axis shows the ratio of the medians of phasic and tonic WPLI scores in the specific electrode pairs. Points below the horizontal dashed line indicate higher values in tonic, whereas points above the line indicate higher WPLI scores in the phasic state
Supplementary material
(Table S1, Table S2, Table S3)