|
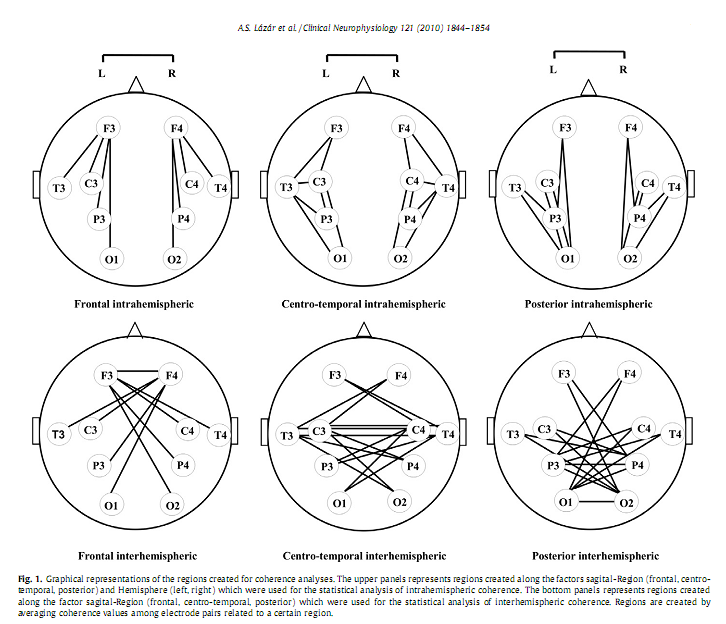
DOI: 10.1016/j.clinph.2010.03.054 Alpár Sándor Lázár a, *, Zsolt Iosif Lázár b , Andrea Bíró c , Miklós Győri d , Zsanett Tárnok c , Csilla Prekop c , András Keszei a , Krisztina Stefanik d , Júlia Gádoros c , Péter Halász c , Róbert Bódizs a a Institute of Behavioural Sciences, Semmelweis University, Budapest, Hungary * Corresponding author. Present address: Surrey Sleep Research Centre, University of Surrey, Egerton Road, Guildford, Surrey GU2 7XP, United Kingdom. Tel.: +44 1483 683341; fax: +44 1483 689790. AbstractObjective: To investigate whether sleep macrostructure and EEG power spectral density and coherence during NREM sleep are different in Asperger syndrome (AS) compared to typically developing children and adolescents. Keywords: Asperger syndrome; Polysomnography; Power spectrum density; Phase coherence; Frontal lobe; Neural connectivity 1. IntroductionSleep holds promise as a sensitive indicator of changes in brain neuronal organization in a large number of conditions, including psychiatric (Leistedt et al., 2009) and neurodevelopmental disorders (Lázár and Bódizs, 2008). Asperger syndrome (AS) is a neurodevelopmental disorder characterised by impairment in social interactions, manifest repetitive and stereotyped behaviours and interests without signi?cant delay in language or cognitive development (APA, 2000). Genetic, neurophysiologic, cognitive and behavioural data support the hypothesis that AS is a variant of autism located at the milder end of the spectrum of autistic disorders (Frith, 2004). This may imply that neurobiological ?ndings for high functioning autistic patients can in part be generalized to AS. Assessments of brain development based on measurement of head circumference, magnetic resonance imaging and post-mortem brain weight revealed that autism is characterised by a period of unusually rapid rate of early brain growth followed by abnormally slow or arrested growth (Redcay and Courchesne, 2005). It has been proposed that this early overgrowth interferes with the normal developmental trajectory of connectivity in the cortex (Courchesne and Pierce, 2005). Post-mortem neuropathologic studies of autistic brain have shown various abnormalities (Bailey et al., 1998; Casanova et al., 2002). These abnormalities include changes in the cortical microanatomy, mainly in frontal areas and this may provide evidence for cellular abnormalities and processes that may underlie the brain growth abnormalities which primarily affect the frontal lobe (Carper and Courchesne, 2005; Herbert et al., 2004). It has been hypothesized that these altered patterns of brain neural development result in a local overconnectivity in the frontal cortex and a reduction in long-distance cortical–cortical coupling (Courchesne and Pierce, 2005). The frontal overconnectivity and the long-distance underconnectivity are thought to underlie the cognitive characteristics of autism spectrum disorders (ASD). In accordance with these studies, functional imaging assessments showed that in autistic subjects brain activity was less synchronized across activated brain areas during a variety of cognitive tasks, including sentence comprehension (Just et al., 2004), executive functions (Just et al., 2007; Koshino et al., 2008), visuo-motor performance (Villalobos et al., 2005), social cognition (Castelli et al., 2002; Kana et al., 2008) and also during the baseline resting-state (Cherkassky et al., 2006). These ?ndings imply that impairments in cognitive domains such as executive function (Hill and Bird, 2006), complex information processing (Minshew et al., 2002), theory of mind (Baron-Cohen et al., 1985) and empathy (Baron-Cohen, 2002) may all be related to abnormalities in neocortical connectivity in ASD. EEG studies and analyses of the EEG during NREM in particular may provide further insight into functional brain connectivity (Miyamoto et al., 2003) also in ASD (Rippon et al., 2007); Several relevant EEG measures are available. An EEG spectral pro?le in NREM sleep is characteristic for an individual, possibly, re?ecting individual traits of functional neuroanatomy (Finelli et al., 2001; De Gennaro et al., 2008). Developmental features and functional as well as structural characteristics of cortico-cortical and thalamo-cortical networks are likely to have a general effect upon a large range of EEG frequencies. The various frequencies in the EEG re?ect different neural sources that subserve different brain functions (Buzsáki and Draguhn, 2004) and studying EEG spectra topographically and over a large range of frequencies may provide information about the underlying neurophysiological systems. Slow waves and sleep spindles are key EEG characteristics of NREM sleep and are functionally dependent on the thalamo-cortical network (Steriade, 2006), a system shown to be modi?ed in autism (Tsatsanis et al., 2003; Hardan et al., 2006). These EEG activities have been shown to be affected in small groups of AS subjects (Godbout et al., 2000; Limoges et al., 2005). However, there are currently no data of spectral measures involving a broad range frequency bands and topographic patterns in subjects with ASD. An EEG measure particularly sensitive to changes in connectivity is EEG coherence. Based on the principle ‘What is wired together, ?res together’ it is assumed that EEG phase coherence indices, which are primarily measures of phase correlation, re?ect synchronous co-activation of different brain areas (see a review in Sauseng and Klimesch, 2008). Studies in control subjects have shown that both intrahemispheric and interhemispheric coherence of EEG activity reaches a high level in NREM sleep primarily in low delta frequency band (1–2 Hz) and is largely independent of the signal amplitude (Achermann and Borbély, 1998a) re?ecting large-scale functional connectivity of brain regions (Achermann and Borbély, 1998b). NREM sleep speci?c inter- and intrahemispheric EEG coherence is enhanced by learning re?ecting possible reactivation of learning induced brain connections (Mölle et al., 2004). Sleep coherence measures may be relevant for understanding the abnormal functional neuroarchitecture assumed to underline the particular behavioural and cognitive phenotype in ASD. It is important to mention that the neuroarchitectural substrate of the two types of coherences is different. The transcallosal ?bres contribute to interhemispheric coherence while other types of ?bres, including subcortical–cortical and cortico-cortical ?bers, contribute to intrahemispheric coherence (Nielsen et al., 1993). Some of the previous PSG sleep studies in subjects with high functioning autism (HFA) and AS reported alterations in sleep macrostructure such as longer sleep latency, more frequent nocturnal awakenings, lower sleep ef?ciency, increased duration of stage 1 sleep, and decreased slow-wave sleep (Godbout et al., 2000; Limoges et al., 2005). The results of other studies, however, are not consistent with these results (Bruni et al., 2007; Malow et al., 2006; Miano et al., 2007; Tani et al., 2004). This may be due to methodological issues related to the subjects’ age range, distinct subtypes of ASD or co-morbid mental retardation. More detailed analyses of NREM EEG identi?ed a decreased number a visually detected sleep spindles (Godbout et al., 2000; Limoges et al., 2005), a non-signi?cant decrease in delta and increase in theta power (Tani et al., 2004), and a signi?cant increase (Bruni et al., 2007)of A1 type Cyclic Alternating Pattern, which supposedly re?ects an altered thalamo-cortical and cortico-cortical connectivity pattern, in subject with AS and HFA (Bruni et al., 2007) The current study was designed to extend previous sleep research in AS. Sleep macrostructure was analyzed to further explore PSG determined sleep patterns in AS, and to better understand the basis of the frequent sleep complaints in this population in this vulnerable period from childhood to late adolescence. The regional distribution of spectral activity across a wide range of frequency bands, and of inter- and intrahemispheric coherence was analyzed to gain a better insight into the functional brain architecture underpinning the peculiar cognitive, affective and behavioural phenotype in AS. Based on the hypothesized changes of the thalamo-cortical system in ASD (Tsatsanis et al., 2003; Hardan et al., 2006; Limoges et al., 2005) we predicted an altered NREM sleep EEG spectral pro?le across a large range of frequencies in children and adolescents with AS. Based on the neurobiological, neuropsychological, functional imaging data and on the long-distance underconnectivity hypothesis of the frontal region with other brain areas (Courchesne and Pierce, 2005; Just et al., 2004) in subjects with ASD we predicted a decreased inter- and intrahemispheric coherence of NREM EEG between the frontal region and other cortical areas in AS. Local over-connectivity could not be assessed by coherence analyses, because this requires high density EEG recordings (Grieve et al., 2003) which exceeded the technical resources available in the current study. 2. Methods2.1. SubjectsEighteen un-medicated subjects (all males) with AS frequenting the outpatient care of Vadaskert Child Psychiatric Hospital, Budapest and 14 control (CONT) subjects were recruited in a multicentre sleep study. Parents of the participating children and subjects above the age of 18 years signed the informed consent approved by the ethics committee of Semmelweis University, Budapest, Hungary. Principles of the Declaration of Helsinki were followed. Parents were interviewed extensively with respect to all behavioural and cognitive characteristics of their children. All subjects went though a comprehensive clinical assessment. The diagnosis of AS was based on ICD-10 criteria, and also con?rmed by the Autism Diagnostic Observation Schedule (ADOS) criteria and performed by experienced clinicians from the Autism Foundation and Research Group, Budapest. All subjects with AS participated in regular meetings for special education purposes in the framework of the Vadaskert Child Psychiatric Hospital. No subject had a history of verbal language delay, any neurological, or co-morbid psychiatric disorder. No subject exhibited spike wave EEG activity. No subjects with reported sleep problems were enrolled in the study. Subjects were matched in non-verbal IQ [mean Raven’s Progressive Matrices row score CONT: 49.9 (SD = 6.5) vs. AS: 51 (SD = 8.8), t = 0.34, P = 0.741], gender and lateralization. There was a statistically non-signi?cant difference between the mean age of the groups [mean age expressed in months, CONT: 177 (SD = 41), age range: 90–260 vs. AS: 158 (SD = 48), age range: 108–260; t = 1.67, P = 0.253]. The subjects (8 patients with AS) assessed in the sleep laboratory of the Institute of Behavioural Sciences, Semmelweis University were included only in the macrostructural sleep analyses, because the EEG references and sampling ratewas slightly different between the two laboratories. This could possibly have affected spectral and coherence indices. The spectral and coherence analysis was based on a sample of 24 subjects (14 CONT and 10 AS) assessed in the sleep laboratory of the Vadaskert Child Psychiatric Hospital. The age [CONT: 177 (SD = 41) vs. AS: 150 (SD = 52); t = 1.41, P = 0.172] and IQ [CONT: 49.9 (SD = 6.5) vs. AS: 52.9 (SD = 5.4); t = 0.97, P = 0.340] matching between control and patient groups in this sub-sample was similar to that of the combined sample. 2.2. MeasuresEEG, EOG, EMG and ECG were recorded on two consecutive nights. A 10 channel (F3, F4, C3, C4, P3, P4, T3, T4, O1, O2) EEG montage was used. Ag/AgCl electrodes were ?xed with EC Grass electrode gel. In one of the laboratories (Semmelweis University) signals were collected, pre-?ltered, ampli?ed and digitized at a sampling rate of 249 Hz/channel by using the 30 channel Flat Style SLEEP La Mont Headbox with implemented second order ?lters at 0.5 Hz (high pass) and 70 Hz (low pass) as well as the HBX32-SLP 32 channel preampli?er (La Mont Medical Inc. USA). In the other sleep laboratory (Vadaskert Child Psychiatric Hospital) a physically linked mastoid reference was applied. By using a BQ 132S Aquisition Headbox (Micromed, Italy) for polysomnographic data recording EEG and polygraphic data was high-pass ?ltered at 0.33 Hz and low-pass ?ltered at 1500 Hz by a 40 dB/decade anti-aliasing hardware input ?lter. Data were collected with 12 bit resolution and with an analogue to digital conversion rate of 4096 Hz/channel (synchronous). A further 40 dB/decade anti-aliasing digital ?lter was applied by digital signal processing which low-pass ?ltered the data at 120 Hz. After this the digitized and ?ltered EEG was subsequently undersampled at 256 Hz and then subjected to spectral and coherence analyses. PSG assessment was performed by the same specialists and by the use of standard procedures in both laboratories. The timing of lights off was determined by subjects’ sleep–wake habit, and the awakenings were spontaneous. The ?rst night served as an adaptation period to the sleep laboratory conditions. The EEGs obtained during the second night EEG recording were visually scored by an experienced scorer (ASL), with an epoch length of 20 s according to standard criteria (Rechtschaffen and Kales, 1968). After visual artefact rejection, stages 2, 3 and 4 of NREM sleep were subjected to spectral and coherence analyses. The spectra and coherences were calculated by Welch’s periodogram method using 4 s long non-overlapping epochs each linearly detrended. A 1024 point Hanning window was applied to minimize leakage. The calculations were done in the Python programming language (Python, 2009) using the SciPy and Matplotlib packages. The power spectrum density was computed by the following function call: where freq contains the frequencieswhile spec the return values for the spectral density. The function for coherence (cohere) has the same arguments only with two input data vectors instead of one. Absolute and relative power spectrum density (PSD) and coherence indices were computed for the delta (0.5–4 Hz), theta (4.25–7.75 Hz), alpha (8–10.75 Hz), sigma (11–15 Hz), beta (15.25–25 Hz), gamma 1 (25.25–35 Hz) and gamma 2 (35.25– 45 Hz) frequency bands. The standard frequency bands were assigned in accordance with previous studies (e.g. Ferri et al., 2000). Because there are only a low number of data points in most of these intervals (4 points/Hz) the average spectral density if calculated by simple summation is very sensitive to minuscule shifts in the band boundaries. In order to eliminate this discontinuous dependence, reduce the sensitivity of the average to the band limits and make the method robust, the averaging was performed by integrating numerically the linearly interpolated spectrum (and coherence) over the different regions. The used functions were: spl = scipy.interpolate.splrep(freq, spec, k =1) average = scipy.interpolate.splint(f_low, f_high, spl)/(f_high–f_low), where f_low and f_high are the limits of the frequency region. The gained absolute and relative PSD data from the ten derivations were grouped into six regions along a sagital-Region (sRegion: frontal, centro-temporal, and posterior) and Hemisphere factor (left and right) and averaged over each region so as to reduce the number of statistical comparisons. Thus the regions were left frontal (F3), right frontal (F4), left centro-temporal (C3, T3), right centro-temporal (C4, T4), left posterior (P3, O1), and right posterior (P4, O2), respectively (Fig. 1). In order to analyze intrahemispheric coherence we employed the same two factors (sRegion and hemisphere) averaging coherence data from all intrahemispheric electrode pairs related to a speci?c area. Thus the regions were left frontal (F3–C3, F3–T3, F3–P3, F3–O1), right frontal (F4–C4, F4–T4, F4–P4, F4–O2), left centro-temporal (F3–C3, C3–T3, C3–P3, C3–O1, F3–T3, T3–P3, T3–O1), right centro-temporal (F4–C4, C4–T4, C4–P4, C4–O2, F4–T4, T4–P4, T4–O2), left posterior (F3–P3, T3–P3, C3–P3, P3–O1, F3–O1, C3–O1, T3–O1), and right posterior (F4–P4, T4–P4, C4–P4, P4–O2, F4–O2, C4–O2, T4–O2), respectively. In the case of interhemispheric coherence we implicitly created only a sRegion factor averaging coherence data across all interhemispheric electrode pairs related to the speci?c sagital area. Consequently there was a frontal (F3–F4, F3–C4, F3–T4, F3–P4, F3–O2, F4–C3, F4–T3, F4–P3, F4–O1), a centro-temporal (F4–C3, C3–C4, C3–T4, C3–P4, C3–O2, F3–C4, C4–T3, C4–P3, C4–O1, F4–T3, C4–T3, T3–T4, T3–P4,T3–O2, F3–T4, C3–T4, T4–P3,T4–O1) and a posterior (F4–P3, C4–P3, T4–P3, P3–P4, P3– O2, F3–P4, C3–P4, T3–P4, P4–O1, F4–O1, C4–O1, T4–O1, P4–O1, O1–O2, F3–O2, C3–O2, T3–O2, P3–O2) sagital-Region (Fig. 1) 2.3. Statistical analyses2.3.1. Group comparisonsAlthough the studied groups were comparable and there was only a slight and statistically non-signi?cant difference in age, we nevertheless used age as a co-variate in all statistical analyses concerning quantitative EEG measures in order to minimize the bias caused by this confounding factor in the assessment of inter-group differences with respect to EEG power and coherence (see Supplementary data; S1). Statistical analyses for spectral measures were applied in two consecutive steps. First, we employed multivariate analysis of covariance in order to analyze group differences in absolute and relative power spectrum density for the entire frequency range (absolute total power) and then for each frequency band separately. In these analyses we focused on the main effects of factor Group (between factor: Control and AS) and on interactions between factor Group, factor sagital-Region (sRegion: frontal, centro-temporal, and posterior) and factor Hemisphere (left and right) within factors (2 Groups x 3 sRegions x 2 Hemispheres). If signi?cant (P < 0.05) interactions emerged we used post hoc Fisher Least Signi?cance Difference (LSD) tests to explore whether the observed sRegion and/or Hemisphere factor dependent group differences were statistically signi?cant (P < 0.05) or not. The statistical analyses of coherence was also performed in several consecutive steps progressing from ‘global’ to ‘local’ effects with respect to both frequency and topography. In the ?rst step focusing at the entire frequency range (0.5–45 Hz) we used a multivariate model including the between factor Group and two within factors: sRegion (frontal, centro-temporal, posterior) and Type of coherence (inter- or intrahemispheric). In the next step still focusing upon the entire frequency range we analyzed group differences in intrahemispheric coherence including in the multivariate model the between factor Group and the within factors sRegion and Hemisphere (left and right). In a subsequent exploratory analysis we assessed group differences of inter- and intrahemispheric coherence measures for each frequency band separately. Here we looked at the abovementioned interactions (interhemispheric coherence: Group x sRegion; intrahemispheric coherence: Group x sRegion x Hemisphere). If signi?cant interactions emergedwe performed post hoc Fisher LSD tests to analyze the group differences in more detail. In a ?nal step we aimed to identify the speci?c subregion (electrode pair) contributing to a speci?c regional group difference. This was purposeful, because the regions employed in the multivariate models consisted of averaged values of coherence indices belonging to a higher number of electrode pairs. Thus we aimed to delimit the cortical subregion showing to be mostly different in between the groups. For this purpose we applied univariate analysis of covariance. In order to avoid the increased risk of type I error due to multiple comparisons we resorted to Bonferroni-type corrections. That is we set the a for the entire set n comparisons (number of electrode pairs included in the analyzed region x 7 frequency bands) (by taking the alpha value for each comparisons) equal to 0.05/n. It is important to mention that the average coherence values across all electrode pairs within a region are biased toward the closest electrode pairs within the same region because of volume conduction. This, however, should not lead to any change in the signi?cance of the group differences. Statistical analyses were performed using STATISTICA 7. (StatSoft Inc. USA) and SPSS 15.0.1 for Windows (SPSS, Inc. USA)
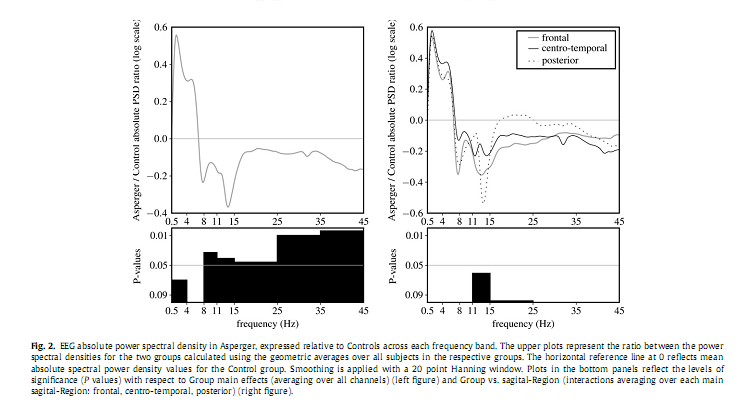
3. Results3.1. Sleep macrostructureThe AS group spent signi?cantly more time in bed, had a longer sleep onset latency, a somewhat lower sleep ef?ciency and longer wake after sleep onset. Differences in SWS between the AS and controls were not statistically signi?cant (Table 1). These differences between AS and controls were not statistically signi?cant in the data set used for the qEEG analyses, although the numerical differences were in the same direction. 3.2. Absolute power spectrum densityAnalyses of the absolute total PSD revealed neither a main effect for the factor Group nor any interaction. Analyses of PSD per frequency band revealed a signi?cant overall decrease in alpha [F(1,21) = 5.232, P = 0.033], sigma [F(1,21) = 4.725, P = 0.041], beta [F(1,21) = 4.497, P = 0.046], gamma 1 [F(1,21) = 8.078, P = 0.01], and gamma 2 [F(1,21) = 10.772, P = 0.004] in the AS group compared to controls (Fig. 2). We observed a considerable overall increase in delta power inAS [F(1,22) = 5.634, P = 0.027],which after controlling for age was no longer signi?cant [F(2,42) = 3.632, P = 0.07].
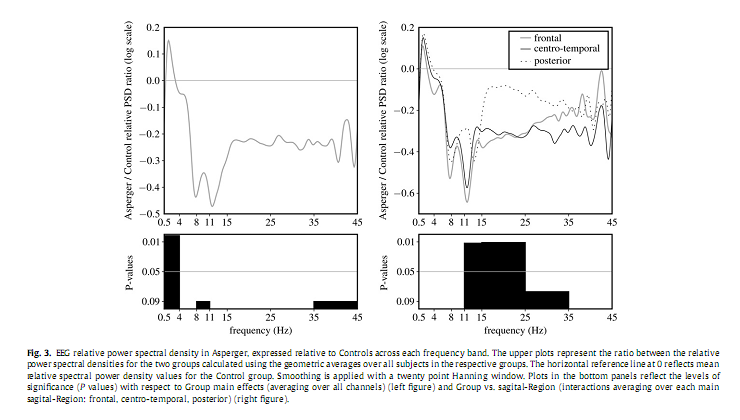
3.3. Relative power spectrum densityAs shown in Fig. 3 relative delta PSD exhibited a signi?cant main effect for the factor Group [F(1,21) = 12.067, P = 0.002] for delta, pointing to an overall increase of the relative spectral power in AS group compared to the Controls. Furthermore, a signi?cant interaction between the factors Group and sRegion in the sigma [F(2,42) = 4.875, P = 0.012] and beta [F(2,42) = 5.252, P = 0.011] frequency bands emerged. Post hoc analysis revealed a signi?cant decrease of relative sigma PSD over the frontal (P = 0.02), and of relative beta PSD over the centro-temporal (P = 0.025) areas. Please note that in all of these analyses age was used as a co-variate.
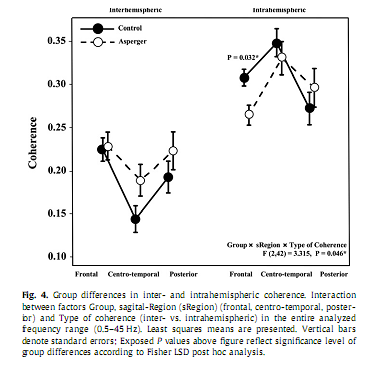
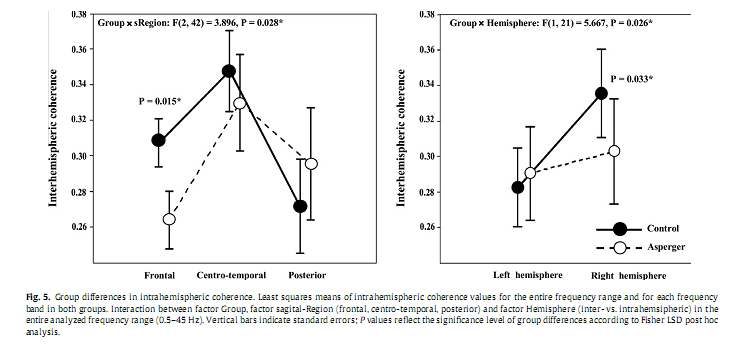
3.4. Coherence3.4.1. Entire frequency bandIn the ?rst step, analyzing group differences in coherence with respect to the entire frequency range we found a signi?cant Group x sRegion x Type of coherence interaction [F(2,42) = 3.315, P = 0.046]. Post hoc analysis revealed signi?cantly lower values of intrahemispheric coherence over the frontal region (P = 0.032) in the AS group compared to Controls, while interhemispheric coherence was not signi?cantly different between the groups (Fig. 4). In the second step, analyzing group differences in intrahemispheric coherence over the entire frequency range, we found a signi?cant interaction between the factors Group and sRegion [F(2,42) = 3.896, P = 0.028] and the factors Group and Hemisphere [F(1,21) = 5.667, P = 0.027]. As shown in Fig. 5, Fisher LSD Post hoc analyses revealed signi?cantly lower values of intrahemispheric coherence in AS compared to the Controls over the frontal (P = 0.015) region and the right hemisphere (P = 0.033).
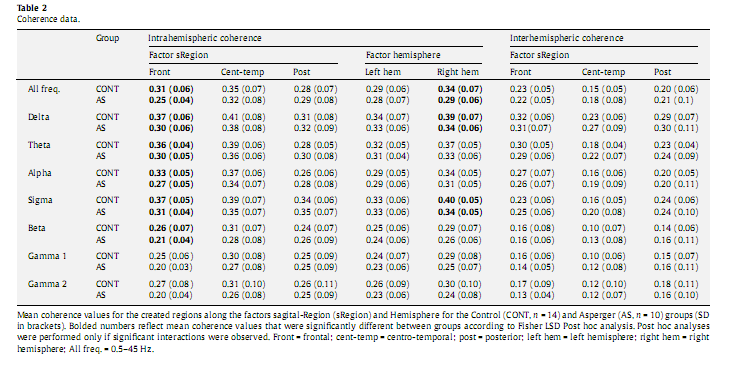
3.4.2. Individual frequency bandsBased on above presented signi?cant group differences involving only the intrahemispheric coherence,wenext analyzed group differences and interactions solely for this type of coherence measure, addressing each frequency band separately for exploratory purposes (Table 2). We found recurrent signi?cant interactions between the factors Group and sRegion in each frequency range: delta [F(2,42) = 3.644, P = 0.035], theta [F(2,42) = 3.786, P = 0.031], alpha [F(2,42) = 3.625, P = 0.035], sigma [F(2,42) = 4.181; P = 0.022], beta [F(2,42) = 3.466, P = 0.040], gamma 1 [F(1,21) = 3.348, P = 0.045], and gamma 2 [F(2,42) = 3.358, P = 0.044]. We also observed signi?cant interactions between the factors Group and Hemisphere in the delta [F(1,21) = 9.949, P = 0.005], theta [F(1,21) = 4.567, P = 0.045], sigma [F(1,21) = 5.505, P = 0.029], gamma 1 [F(1,21) = 4.584, P = 0.044], and gamma 2 [F(1,21) = 5.641, P = 0.027] frequency bands. Post hoc analysis revealed signi?cantly lower intrahemispheric coherence values in AS compared to the Controls over the frontal region in delta (P = 0.006), theta (P = 0.018), alpha (P = 0.012), sigma (P = 0.016) and beta (P = 0.048), as well over the right hemisphere in delta (P = 0.019) and sigma (P = 0.016) frequency bands (Table 2).
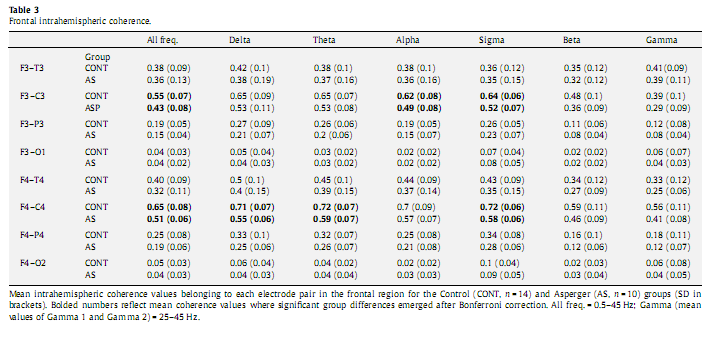
3.5. Univariate analysis of coherenceUsing univariate analysis of covariance we computed group differences along the electrode pairs belonging to the affected regions as revealed by the multivariate analysis of covariance. Because all signi?cant differences along the factor sRegion emerged exclusively over the frontal region we included all intrahemispheric electrode pairs related to this region (F3–C3, F3–T3, F3–P3, F3– O1, F4–C4, F4–T4, F4–P4, F4–O2) in the analysis. We found significantly lower (P < 0.002) coherence values in the left (F3–C3) and right (F4–C4) fronto-central areas with respect to the entire frequency band (0.5–45 Hz). Subsequently we also analyzed group differences along each frequency band. After we applied Bonferroni correction for the 56 comparisons (8 channels x 7 frequency bands) we found signi?cantly decreased intrahemispheric coherence values over the F4–C4 area in delta (P = 0.004), theta (P = 0.017), and sigma (P = 0.001) as well as in the F3–C3 region in alpha (P = 0.049) and sigma (P = 0.030) frequency bands (Table 3).
4. DiscussionThis is a ?rst study in which whole night NREMsleep dependent EEG spectra and its topography as well as phase coherence in children and adolescents with AS is compared with age and IQ matched controls. Marked changes in both absolute and relative power density values as well as changes in intrahemispheric coherence were observed in AS. In the following we discuss our results in the light of the available data in ASD. Because AS represents only one segment of the autistic spectrum, our inferences and interpretations based on studies in which different or uncontrolled ASD subtypes were studied, need to be cautious. Our observations of increased sleep onset latency, waking after sleep onset and decreased sleep ef?ciency in subjects with AS are in accordance with previous reports of sleep problems in children and adolescents with ASD (Lázár and Bódizs, 2008). Our sleep ef?ciency score in AS (88.8%) is similar to the value of 88.2% which was reported in younger children with ASD who were good sleeper (Malow et al., 2006) or without a reported altered sleep pattern, 89% (Miano et al., 2007), and is slightly higher than in children with AS in a similar age range, 86% (Bruni et al., 2007). The magnitude of the observed differences in wake after sleep onset and sleep ef?ciency are also relatively minor when compared to for example age-related changes in sleep. The relatively minor differences between AS and controls with respect to PSG measures is also re?ected in the loss of statistical signi?cance when the analyses of these data was restricted to the subgroup in which the qEEG analyses was performed. The fact that the signi?cance of group differences did not persist when the analyses restricted to this subgroup should not be interpreted as implying that this subgroup was not representative. In fact, a direct comparison of the two autistic groups studied in the two laboratories showed no signifcant differences in any of the sleep macrostructure measures. The subjects were not reported to have sleep problems, but in neither the controls nor the AS did we measure leg movements and breathing patterns in order to increase compliance. Thus we cannot rule out the possibility that differences in sleep related breath-ing disorders or periodic limb movements exist between the groups and that these differences contribute to differences in sleep structure. The AS group presented with signi?cantly higher anxiety scores on the Child Behaviour Checklist (CBCL). Anxiety may also have contributed to the reduction in sleep ef?ciency in this clinical group. Although it is unlikely, it cannot be ruled out that this may have impacted the spectral data as well. The differences in PSG measures such as sleep ef?ciency are very unlikely to have directly affected the results of the power spectral and coherence analyses because these analyses were based on stage 2, 3 and 4 NREM sleep. Spectral analysis revealed a region independent overall increase of the relative delta activity in AS compared to controls coupled with a regional decrease of the relative frontal sigma, and centrotemporal beta, respectively. In addition we observed a signi?cant region independent overall decrease of the absolute spectral density across a large frequency range (8–45 Hz). These differences cannot be attributed to the non-signi?cant differences in age between the groups because we used age as a co-variate in all analyses. The interpretation of the spectral results is fairly dif?cult because of the paucity of quantitative sleep EEG studies in ASD or related child neuropsychiatric disorders. Previous PSG studies reported decreased slow-wave sleep (Limoges et al., 2005) as well as a non-signi?cant reduction of delta activity in young adults with AS (Tani et al., 2004). However, these studies were carried out in older subjects compared to our groups, and this might account for the distinct slow wave activity (SWA) pro?le reported here. This is reasonable considering that AS is a neurodevelopmental condition showing a different pattern of brain maturation during development (see a review in Frith, 2003). Another recent PSG study investigating children within an age range similar to our participants reported an increase in sleepiness, and in the percentage of synchronized A1 phase of CAP in children with AS compared to age matched controls (Bruni et al., 2007). This observation may be in accordance with our results because sleepiness and synchronized A1 phase of CAP have both been related to EEG activity characterised by a spectral peak in the low frequency range, prevailing over the frontal region (Cajochen et al., 1999; Ferri et al., 2005). In normal developing children and adolescents, delta and theta activity were shown to correlate inversely with brain maturation consistent with a gradual decrease of synaptic density presumably caused by an age-programmed synaptic pruning that decreases waking brain metabolic rate (Campbell and Feinberg, 2009). The decline of delta and theta activity in NREM sleep emerges most abruptly in adolescence due to an escalated brain maturation indexed by synaptic pruning (Campbell et al., 2007) and begins later in boys than in girls (Campbell et al., 2005) suggesting a delayed maturation of the male brain. According to neurobiological and neuropsychological assessments children with ASD may be characterised by delayed brain maturation due to a possible pruning disorder leading to an increased synaptic density and disconnectivity (Frith, 2003) and thereby increased delta activity. Although this interpretation is attractive it is not supported by the fact that the intelligence measures were fairly similar in the two groups. An alternative interpretation of the observed increase in delta activity relates to association between changes in delta activity and sleep loss. The increased relative delta as well as the decreased relative sigma activity in the patient group is reminiscent of the effects of sleep deprivation on the EEG and may suggest an elevated sleep propensity in AS (Dijk et al., 1993; Jenni et al., 2005). The time course of sigma activity and spindle density across subsequent cycles goes in an opposite direction from that of SWA (Ferri et al., 2000). It is important to mention that since we have not found a difference in the total power the signi?cant increase in the relative delta in AS may be directly related to the signi?cant decrease in the absolute high frequency activity (8–45 Hz) It is also important to mention that the sigma activity has been related to spindle activity during NREM sleep reported to be decreased in AS (Godbout et al., 2000; Limoges et al., 2005). Sleep spindles re?ect thalamo-cortical resonance (Steriade, 2006) a system possibly affected in AS (Tsatsanis et al., 2003; Hardan et al., 2006; Limoges et al., 2005). The frontal decrease of the relative sigma activity may be related to a frontal region speci?c de?cit in the thalamo-cortical resonance. Furthermore, the overall decrease of the absolute alpha, beta and gamma EEG power and the centrotemporal relative beta power in the AS group is intriguing, but the interpretation is not straightforward. The most signi?cant reduction emerged in the gamma frequency bands. Short-range gamma synchronization has been proposed to underlie perceptual binding (Singer, 2002), long range coupling of cortical areas has been proposed to subserve the integration of cognitive processes (Miltner et al., 1999). Gamma rhythms are part of background neural activity related to a variety of non-conscious, cortical processes during wakefulness and are also present during sleep and anaesthesia (Steriade et al., 1996). Spontaneous gamma oscillations have been explained by cortical and thalamo-cortical resonant synaptic interactions (Llinás and Ribary, 1993). Although there are a large number of studies related to the signi?cance of waking gamma activity in neuropsychiatric disorders (Herrmann and Demiralp, 2005) there is a paucity of data on gamma activity during sleep. However, we assume that the signi?cant decrease in activity of the high frequency EEG bands may re?ect another aspect of the altered cortico-cortical and thalamo-cortical resonance hypothesized in ASD (Tsatsanis et al., 2003; Hardan et al., 2006; Limoges et al., 2005). The most robust result we observed was the signi?cant intrahemispheric coherence decrease across a large range of frequencies in the experimental group compared to the control one emerging over the frontal region, and over the right hemisphere. The reduction of spectral power in AS, which was observed over a broad frequency range, but not in the delta and theta band, may have contributed to the reduced intrahemispheric coherence in the higher frequency bands (alpha to gamma 2) due to volume conduction (Nunez et al., 1997). However, this would not be expected to affect decreased coherence in the delta and theta frequency bands. Our data of reduced intrahemispheric coherence is in accordance with a recent study of the daytime resting EEG during eyes closed study which reported a signi?cant dysfunctional integration of frontal and posterior brain regions in children with autistic spectrum disorder along with a pattern of neural underconnectivity (Coben et al., 2008). However, in contrast to this study we only found signi?cant difference in intrahemispheric coherence measures and not in interhemispheric measures. This could be due to the different neurophysiological mechanisms engaged by the sleeping brain as compared to wakefulness and also to the clinical subgroup of ASD envisaged in the study. In accordance with Coben et al. (2008), we also found a greater number of signi?cant differences in the coherence vs. power domains. This may suggests that neural organization and connectivity as re?ected in changes in coherence may be a primary dysfunction of the autistic brain (Coben et al., 2008). The robust intrahemispheric coherence decrease in the bilateral fronto-central areas re?ecting a fronto-cortical underconnectivity points to this brain region as an area which is most affected in children with AS. Functional brain imaging has provided evidence that activation in the bilateral dorsolateral prefrontal cortex is associated with several executive functions (Elliott, 2003). This may be related to the currently reported reduced coherence over these areas possibly re?ecting neurobiological alterations underpinning executive dysfunctions described in AS (Hill and Bird, 2006). The reported reduced coherence may also be in accordance with recent fMRI data revealing decreased fronto-posterior functional connectivity during tasks assessing executive functions (Koshino et al., 2008; Just et al., 2007), social cognition (Kana et al., 2008) visuo-motor performance (Villalobos et al., 2005) and also during restful wakefulness (Cherkassky et al., 2006) in subject with ASD. Furthermore, this brain area is also involved in the mirror neuron system proven to be affected in autistic children (Hadjikhani et al., 2006; Oberman et al., 2005). Our data of abnormal intrahemispheric vs. normal interhemispheric coherence may also be in accordance with a brain volumetric study in children with HFA reporting an increase of exclusively of the outer radiate white matter volume composed of intrahemispheric cortico-cortical connections with a frontal predominance (Herbert et al., 2004). The authors suggested an ongoing postnatal process involving white matter in autism that primarily affects intrahemispheric and cortico-cortical connections (Herbert et al., 2004). It is important to note, that the relevance of the above quoted research data for the present study is conceivable only in the broader concept of ASD since these studies employed mostly heterogenic subtypes of autistic conditions. The marked right hemisphere reduction of intrahemispheric coherence reveals that the detected brain neural underconnectivity is considerably lateralized. This may be an AS speci?c sleep EEG marker in accordance with reports pointing to a possible right hemisphere disorder in this clinical category (Ellis and Gunter, 1999) due to a dysfunction of white matter affecting primarily the right hemisphere functioning (Gunter et al., 2002). Some limitations of the study should be considered. Our study may be considered preliminary because of its sample size, which, even though it is larger than the sample size of many other studies in this research area, is still not very large. It is possible that with a bigger sample size more signi?cant differences in spectral and coherence activity would have emerged (see Supplementary Data; S2). Furthermore, the age range of the sample is fairly broadand even though we statistically controlled for the effect of age upon the dependent variables, itmay be argued that such a control is insuf?cient. This is because the brain development follows a nonlinear trendwith aging and also becauseAS exhibits an altered brain developmental pattern compared to typically developing subjects (see Supplementary Data; S1). Our cross sectional study certainly cannot reveal the entire picture but may provide a useful starting point for future sleep studies in larger, more homogenous groups. In conclusion, our sleep EEG ?ndings indicate an altered brain connectivity pattern involving primarily the connection between the frontal region with other posterior cortical areas in children and adolescents with AS. This interpretation of these sleep EEG ?ndings is in accordance with the underconnectivity hypothesis of autistic spectrum disorders (Just et al., 2004) affecting primarily the long-distance fronto-cortical connections (Courchesne and Pierce, 2005; Just et al., 2004). However, this is the ?rst study to provide evidence in this regard on the basis of an exhaustive linear quantitative analysis of whole night NREM sleep dependent oscillatory activity involving a large range of frequencies in children and adolescent with AS. It would be of interest to study the sleep EEG in more populations and subtypes to assess whether these ?ndings are either AS speci?c or rather related to the broader autistic phenotype. 5. Disclosure statementThis is not an industry supported study. The authors have indicated no ?nancial con?icts of interest. AcknowledgementsThe ?rst author thanks Dr. Derk-Jan Dijk for comments on the manuscript. This study was supported by the Hungarian National Scienti?c Research Fund (OTKA T-048927 and OTKA TS-049785) and the National Of?ce for Research and Technology (NKFP-1B/ 020/04). Authors were supported by the Hungarian Academy of Sciences’ János Bolyai Research Fellowship (R.B.) as well as by the National University Research Council of Romania (Grant No. 27687/14.03.2005) and the Marie-Curie Grant No. MTKD-CT- 2004-003134 (Z.I.L).We thank Luca Farkas, Miklós Gauland, Henriett Horváth and Xenia Volovik for professional collaboration. We express our sincere gratitude to the children and young adults who participated in this study and their families. Appendix A. Supplementary data Supplementary data associated with this article can be found, in the online version, at doi:10.1016/j.clinph.2010.03.054. ReferencesAmerican Psychiatric Association: Diagnostic and Statistical Manual of Mental Disorders. 4th ed. Washington, DC: APA; 2000. Achermann P, Borbély AA. Temporal evolution of coherence and power in the human sleep electroencephalogram. J Sleep Res 1998a;7(Suppl. 1):36–41. Achermann P, Borbély AA. Coherence analysis of the human sleep electroencephalogram. Neuroscience 1998b;85:1195–208. Bailey A, Luthert P, Dean A, Harding B, Janota I, Montgomery M, et al. A clinicopathological study of autism. Brain 1998;121:889–905. Baron-Cohen S, Leslie AM, Frith U. Does the autistic child have a ‘‘theory of mind”? Cognition 1985;21:37–46. Baron-Cohen S. The extreme male brain theory of autism. Trends Cogn Sci 2002;6:248–54. Bruni O, Ferri R, Vittori E, Novelli L, Vignati M, Por?rio MC, et al. Sleep architecture and NREM alterations in children and adolescents with Asperger syndrome. Sleep 2007;30:1577–85. Buzsáki G, Draguhn A. Neuronal oscillations in cortical networks. Science 2004;304:1926–9. Cajochen C, Foy R, Dijk DJ. Frontal predominance of a relative increase in sleep delta and theta EEG activity after sleep loss in humans. Sleep Res Online 1999;2:65–9. Campbell IG, Darchia N, KhawWY, Higgins LM, Feinberg I. Sleep EEG evidence of sex differences in adolescent brain maturation. Sleep 2005;28:637–43. Campbell IG, Feinberg I. Longitudinal trajectories of non-rapid eye movement delta and theta EEG as indicators of adolescent brain maturation. Proc Natl Acad Sci USA 2009;106:5177–80. Campbell IG, Higgins LM, Trinidad JM, Richardson P, Feinberg I. The increase in longitudinally measured sleepiness across adolescence is related to the maturational decline in low-frequency EEG power. Sleep 2007;30:1677–87. Carper RA, Courchesne E. Localized enlargement of the frontal lobe in autism. Biol Psychiatry 2005;57:126–33. Casanova MF, Buxhoeveden DP, Switala AE, Roy E. Asperger’s syndrome and cortical neuropathology. J Child Neurol 2002;17:142–5. Castelli F, Frith C, Happé F, Frith U. Autism, Asperger syndrome and brain mechanisms for the attribution of mental states to animated shapes. Brain 2002;125:1839–49. Cherkassky VL, Kana RK, Keller TA, Just MA. Functional connectivity in a baseline resting-state network in autism. Neuroreport 2006;17:1687–90. Coben R, Clarke AR, Hudspeth W, Barry RJ. EEG power and coherence in autistic spectrum disorder. Clin Neurophysiol 2008;119:1002–9. Courchesne E, Pierce K. Why the frontal cortex in autism might be talking only to itself: local over-connectivity but long-distance disconnection. Curr Opin Neurobiol 2005;15:225–30. De Gennaro L, Marzano C, Fratello F, Moroni F, Pellicciari MC, Ferlazzo F, et al. The electroencephalographic ?ngerprint of sleep is genetically determined: a twin study. Ann Neurol 2008;64:455–60. Dijk DJ, Hayes B, Czeisler CA. Dynamics of electroencephalographic sleep spindles and slow wave activity in men: effect of sleep deprivation. Brain Res 1993;626:190–9. Elliott R. Executive functions and their disorders. Br Med Bull 2003;65:49–59. Review. Ellis HD, Gunter HL. Asperger syndrome: a simple matter of white matter? Trends Cogn Sci 1999;3:192–200. Ferri R, Elia M, Musumeci SA, Pettinato S. The time course of high-frequency bands (15–45 Hz) in all-night spectral analysis of sleep EEG. Clin Neurophysiol 2000;111:1258–65. Ferri R, Bruni O, Miano S, Terzano MG. Topographic mapping of the spectral components of the cyclic alternating pattern (CAP). Sleep Med 2005;6:29–36. Finelli LA, Achermann P, Borbély AA. Individual ‘?ngerprints’ in human sleep EEG topography. Neuropsychopharmacology 2001;25:S57–62. Frith C. What do imaging studies tell us about the neural basis of autism? Novartis Found Symp 2003;251:149–66. discussion 166–76, 281–97. Frith U. Emanuel Miller lecture: confusions and controversies about Asperger syndrome. J Child Psychol Psychiatry 2004;45:672–86. Godbout R, Bergeron C, Limoges E, Stip E, Mottron L. A laboratory study of sleep in Asperger’s syndrome. Neuroreport 2000;11:127–30. Grieve PG, Emerson RG, Fifer WP, Isler JR, Stark RI. Spatial correlation of the infant and adult electroencephalogram. Clin Neurophysiol 2003;114:1594–608. Gunter HL, Ghaziuddin M, Ellis HD. Asperger syndrome: tests of right hemisphere functioning and interhemispheric communication. J Autism Dev Disord 2002;32:263–81. Hadjikhani N, Joseph RM, Snyder J, Tager-Flusberg H. Anatomical differences in the mirror neuron system and social cognition network in autism. Cereb Cortex 2006;16:1276–82. Hardan AY, Girgis RR, Adams J, Gilbert AR, Keshavan MS, Minshew NJ. Abnormal brain size effect on the thalamus in autism. Psychiatry Res 2006;147:145–51. Herbert MR, Ziegler DA, Makris N, Filipek PA, Kemper TL, Normandin JJ, et al. Localization of white matter volume increase in autism and developmental language disorder. Ann Neurol 2004;55:530–40. Herrmann CS, Demiralp T. Human EEG gamma oscillations in neuropsychiatric disorders. Clin Neurophysiol 2005;116:2719–33. Review. Hill EL, Bird CM. Executive processes in Asperger syndrome: patterns of performance in a multiple case series. Neuropsychologia 2006;44:2822–35. Jenni OG, Achermann P, Carskadon MA. Homeostatic sleep regulation in adolescents. Sleep 2005;28:1446–54. Just MA, Cherkassky VL, Keller TA, Minshew NJ. Cortical activation and synchronization during sentence comprehension in high-functioning autism: evidence of underconnectivity. Brain 2004;127:1811–21. Just MA, Cherkassky VL, Keller TA, Kana RK, Minshew NJ. Functional and anatomical cortical underconnectivity in autism: evidence from an FMRI study of an executive function task and corpus callosum morphometry. Cereb Cortex 2007;17:951–61. Kana RK, Keller TA, Cherkassky VL, Minshew NJ, Just MA. Atypical frontal-posterior synchronization of Theory of Mind regions in autism during mental state attribution. Soc Neurosci 2008;3:1–18. Koshino H, Kana RK, Keller TA, Cherkassky VL, Minshew NJ, Just MA. FMRI investigation of working memory for faces in autism: visual coding and underconnectivity with frontal areas. Cereb Cortex 2008;18:289–300. Lázár AS, Bódizs R. The structure and patterns of sleep in autism spectrum disorders. Psychiatr Hung 2008;23:109–28. Review. Hungarian. Leistedt SJ, Coumans N, Dumont M, Lanquart JP, Stam CJ, Linkowski P. Altered sleep brain functional connectivity in acutely depressed patients. Hum Brain Mapp 2009;30:2207–19. Limoges E, Mottron L, Bolduc C, Berthiaume C, Godbout R. Atypical sleep architecture and the autism phenotype. Brain 2005;128:1049–61. Llinás R, Ribary U. Coherent 40-Hz oscillation characterizes dream state in humans. Proc Natl Acad Sci USA 1993;90:2078–81. Malow BA, Marzec ML, McGrew SG, Wang L, Henderson LM, Stone WL. Characterizing sleep in children with autism spectrum disorders: a multidimensional approach. Sleep 2006;29:1563–71. Miano S, Bruni O, Elia M, Trovato A, Smerieri A, Verrillo E, et al. Sleep in children with autistic spectrum disorder: a questionnaire and polysomnographic study. Sleep Med 2007;9:64–70. Miltner WH, Braun C, Arnold M, Witte H, Taub E. Coherence of gamma-band EEG activity as a basis for associative learning. Nature 1999;397:434–6. Minshew NJ, Sweeney J, Luna B. Autism as a selective disorder of complex information processing and underdevelopment of neocortical systems. Mol Psychiatry 2002;7:S14–5. Review. Miyamoto H, Katagiri H, Hensch T. Experience-dependent slow-wave sleep development. Nat Neurosci 2003;6:553–4. Mölle M, Marshallm L, Gais S, Born J. Learning increases human electroencephalographic coherence during subsequent slow sleep oscillations. Proc Natl Acad Sci USA 2004;101:13963–8. Nielsen T, Montplaisir J, Lassonde M. Decreased interhemispheric EEG coherence during sleep in agenesis of the corpus callosum. Eur Neurol 1993;33:173–6. Nunez PL, Srinivasan R, Westdorp AF, Wijesinghe RS, Tucker DM, Silberstein RB, et al. EEG coherency. I: Statistics, reference electrode, volume conduction, Laplacians, cortical imaging, and interpretation at multiple scales. 1. Electroencephalogr Clin Neurophysiol 1997;103:499–515. Oberman LM, Hubbard EM, McCleery JP, Altschuler EL, Ramachandran VS, Pineda JA. EEG evidence for mirror neuron dysfunction in autism spectrum disorders. Brain Res Cogn Brain Res 2005;24:190–8. Python. Of?cial homepage, 2009. Available at: http://www.python.org, Scienti?c Python homepage, http://www.scipy.org, Matplotlib homepage, http:// matplotlib.sourceforge.net. Rechtschaffen A, Kales A. Manual of standardized terminology, techniques and scoring system for sleep stages of human subjects. Los Angeles: UCLA Brain Information Service/Brain Research Institute; 1968. Redcay E, Courchesne E. When is the brain enlarged in autism? A meta-analysis of all brain size reports. Biol Psychiatry 2005;58:1–9. Rippon G, Brock J, Brown C, Boucher J. Disordered connectivity in the autistic brain: challenges for the ‘‘new psychophysiology”. Int J Psychophysiol 2007:63164–72. Sauseng P, KlimeschW.What does phase information of oscillatory brain activity tell us about cognitive processes? Neurosci Biobehav Rev 2008;32:1001–13. Review. Singer W. Gamma oscillations and cognition. In: Reisin RC, Nuwer M, Hallet M, Medina C, editors. Advances in clinical neurophysiology. Clin. Neurophysiol. (Suppl.) 2002;vol. 54. The Netherlands: Elsevier; 2002. p. 3–22. Steriade M. Grouping of brain rhythms in corticothalamic systems. Neuroscience 2006;137:1087–106. Steriade M, Amzica F, Contreras D. Synchronization of fast (30–40 Hz) spontaneous cortical rhythms during brain activation. J Neurosci 1996;16:392–417. Tani P, Lindberg N, Nieminen-von Wendt T, von Wendt L, Virkkala J, Appelberg B, et al. Sleep in young adults with Asperger syndrome. Neuropsychobiology 2004;50:147–52. Tsatsanis KD, Rourke BP, Klin A, Volkmar FR, Cicchetti D, Schultz RT. Reduced thalamic volume in high-functioning individuals with autism. Biol Psychiatry 2003;53:121–9. Villalobos ME, Mizuno A, Dahl BC, Kemmotsu N, Müller RA. Reduced functional connectivity between V1 and inferior frontal cortex associated with visuomotor performance in autism. NeuroImage 2005;25:916–25 |